
Understanding Single Candlestick Patterns
📊 Learn key single candlestick patterns in trading that reveal market sentiment fast. Improve your equity, forex & commodity trades with expert insights 📈
Edited By
Liam Edwards
Candlestick patterns form the backbone of technical analysis in financial trading. Originally developed by Japanese rice traders centuries ago, these charts visually represent price movements over specific time periods, helping traders spot market sentiment quickly.
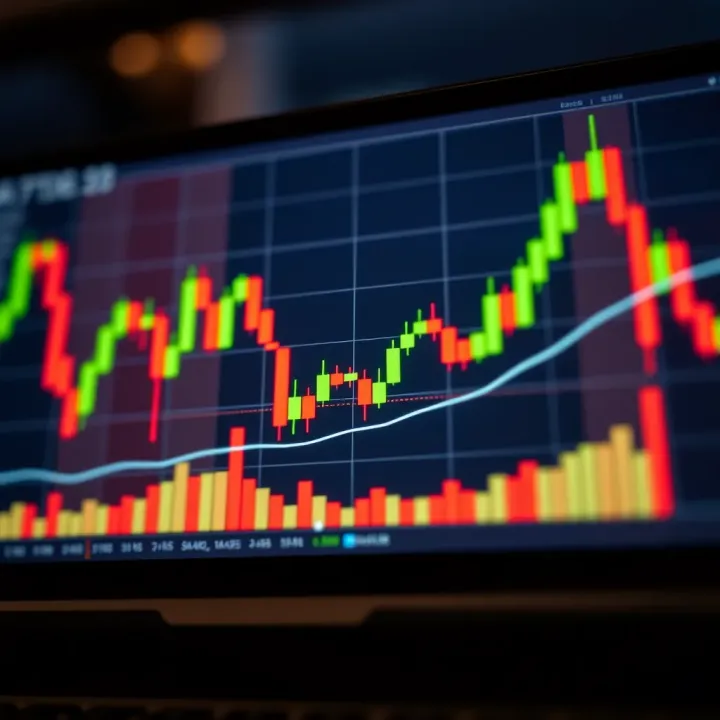
Each candlestick shows four prices: the opening, closing, highest, and lowest within that interval. The body of the candle captures the area between open and close, coloured differently to indicate bullish (price up) or bearish (price down) action. The thin lines above and below—called shadows or wicks—indicate the price extremes.
Traders in Pakistan, whether dealing with PSX shares or global markets like Forex or commodities, rely on recognising key candlestick patterns to time their trades better.
Visual Clarity: Candlesticks offer more detail than simple line charts, allowing traders to assess momentum, uncertainty, and potential reversals at a glance.
Pattern Recognition: Repeated configurations of candles reveal common behaviours, such as buying pressure or distribution by sellers.
Decision Support: They complement other tools like moving averages or RSI, adding a layer of confirmation before entering or exiting trades.
Imagine you hold a stock listed on the Pakistan Stock Exchange (PSX) that has been sliding for days. One morning, you spot a hammer candlestick—a small body with a long lower shadow—suggesting sellers pushed the price down but buyers regained control by close. This often signals a bullish reversal, so you might consider buying or tightening your stop-loss.
Understanding these patterns is especially useful during volatile sessions affected by political developments or economic announcements in Pakistan.
In upcoming sections, we will explore common bullish and bearish candlestick patterns, how to distinguish reliable signals from noise, and ways to integrate them into your trading plans effectively.
Candlestick charts are fundamental tools for traders and investors aiming to understand price movements clearly. Unlike simple line charts, they visually represent the opening, closing, high, and low prices within a specific period. This detailed snapshot helps you grasp not just direction but market sentiment, making it easier to make informed trading decisions. For Pakistani traders, especially when analysing volatile local markets or international commodities, candlestick charts bring transparency and quick insights.
Candlestick charts have their roots in 18th-century Japan, originally developed by rice traders to track market psychology over time. This historical context matters today — these charts were among the first tools created with the trader’s mindset, focusing on how price action reflects human behaviour. Knowing this helps appreciate their role beyond numbers; they tell a story about market emotion and shifts.
Every candlestick consists of three main parts: the body, wick, and shadows. The body represents the price range between the opening and closing of a given time period, while the wicks (or shadows) indicate the extremes — the highest and lowest prices reached. Understanding these components lets traders identify whether buyers or sellers dominated during that interval, signalling possible trends or reversals.
Key to reading candlesticks is recognising the four price points they show: open, close, high, and low. The open is where the price starts in that time frame; the close is where it ends. High and low show the extremes during the period. For instance, a candlestick with a small body but long upper wick suggests buyers pushed prices up but sellers eventually pulled them back down.
Colour plays a crucial role as well. Typically, a green or white candle signals that the closing price was higher than the opening price — bullish sentiment. In contrast, a red or black candle means the closing price fell below the opening, indicating bearish pressure. These colour cues help you quickly interpret market mood without digging into the numbers every time.
Mastering how to read candlesticks equips traders to spot momentum shifts and potential opportunities in real time, a vital skill for navigating both Pakistan’s equity markets and global exchanges.
Bullish candlestick patterns signal potential rising trends or reversals from bearish phases. For traders and investors in Pakistan’s growing markets, recognising these patterns early can improve entry timing and reduce risks. They act like red flags or green lights in trading charts, pointing to moments when buyers might be gaining control.
A hammer signals a possible bullish reversal after a downtrend. Its small body at the top with a long lower wick shows that although sellers pushed prices down during the session, buyers managed to pull them back near the opening level. For example, if Oil and Gas Development Company Ltd (OGDCL) stock shows a hammer pattern after consecutive losses, this might hint at a bounce upcoming in the next sessions.
The practical use of the hammer pattern lies in spotting potential turnaround points. However, traders should confirm the signal with the next candle or support levels. Simply seeing a hammer does not guarantee a trend change, but it raises a warning for those holding or watching that stock.
An inverted hammer also suggests a bullish reversal but looks like an upside-down hammer — a small body near the low with a long upper wick. This pattern indicates buyers tried to push prices higher but sellers forced a drop, yet the buyers' initial strength may still prevail.
Consider the Karachi Electric (KEL) share price showing an inverted hammer after a fall. It means buyers tested the waters with higher prices, though selling pressure remains. Traders often watch for a confirming higher close in the following day before taking action.
The bullish engulfing pattern appears when a small red (bearish) candle is completely followed by a larger green (bullish) candle that 'engulfs' the previous one. This shows momentum has shifted strongly to buyers. In Pakistan’s textile sector, if Nishat Mills displays this pattern, it can hint at a rally starting.
This pattern is more reliable than single-candle ones as it clearly shows battle between bears and bulls is won by bulls. Traders use it to identify trend reversals or entries, especially on daily charts with good volume confirmation.
The morning star is a three-candle pattern signalling strong bullish reversal after a downtrend. It starts with a long bearish candle, followed by a small-bodied candle (indecision), and then a large bullish candle. This forms a visual ‘star’ showing sellers losing grip and buyers gaining control.
For instance, Pakistan State Oil (PSO) stocks falling for days and then forming a morning star may show that investor confidence returns, making it a signal to consider buying. The pattern is valuable for timing entries at trend bottoms, but confirmation through volume or other indicators is advised.
Recognising these bullish patterns in candlestick charts helps Pakistani traders make informed decisions, reducing guesswork in volatile markets. Always combine signals from these patterns with broader analysis like support and resistance levels for better results.
Bearish candlestick patterns help traders spot potential downtrends or selling pressure in the market. Recognising these patterns early can prevent heavy losses and allow better timing for exits or short entries. In the volatile Pakistani stock market or forex trading, being aware of common bearish signals can make a real difference.
A shooting star forms after an uptrend and has a small body near the low of the price range, with a long upper wick. This shows that buyers pushed prices high during the session but sellers eventually forced it down, signalling a possible reversal. In practical terms, the shooting star alerts traders to a weakening bullish momentum, often prompting exit or cautious trades.
For example, a stock rising steadily on the PSX might form a shooting star during the afternoon session, warning traders that the rally could lose steam soon. Confirmation with volume drop or other indicators strengthens this signal.
The hanging man candle appears after an upward move with a small real body near the top and a long lower shadow, highlighting selling pressure during the session. Although the price closes near the open, the shadow suggests someone tried to push prices down. This pattern often warns of possible trend exhaustion, especially if followed by bearish confirmation.
In Pakistan's forex markets, a hanging man pattern in the PKR/USD pair after a strong rally can signal a reversal or correction, prompting traders to tighten stop-loss orders.
This two-candle pattern happens when a small bullish candle is followed by a large bearish candle that fully engulfs it. It signals strong selling overpowering buying momentum, suggesting a shift to downward movement. Traders should watch for confirmation on the next candle or volume spike.
Suppose a commodity like crude oil futures traded in Pakistan shows a bullish day followed by a bearish engulfing candle; traders can anticipate a trend reversal that might favour shorting the market or selling holdings.
The evening star is a three-candle pattern marking a top after an uptrend: a large bullish candle, then a small-bodied candle (indicating indecision), followed by a strong bearish candle. This sequence signals that buyers are losing control, and sellers are stepping in.
This pattern is useful for Pakistani traders dealing in equities or indices like the KSE-100. Spotting an evening star can help avoid buying near peaks and plan timely exits or shorts.
Recognising these bearish candlestick patterns is essential in managing risk and identifying possible reversals in trading. They rarely work alone but give strong clues when combined with other analysis tools.
Candlestick patterns offer practical clues that traders use to understand market momentum and anticipate price movements. Recognising these patterns helps identify whether a trend is continuing or about to reverse, which is vital for making timely decisions in both local and international markets.
Trend identification and reversal signals are the heart of candlestick pattern analysis. For example, a bullish engulfing pattern after a downtrend may signal the start of an upward movement, prompting traders to consider buying. Conversely, spotting a shooting star near a recent high could warn of a potential downward reversal. These signs allow traders to act swiftly and align their positions with the prevailing market direction.
However, using candlestick patterns alone isn’t foolproof. Traders often combine these signals with volume data to validate the strength of the trend change. Higher volume during a bullish engulfing pattern, for instance, suggests stronger buying pressure, reinforcing the likelihood of a genuine trend reversal rather than a false alarm.
Confirming patterns with volume and other indicators adds a layer of certainty. Volume is a straightforward yet powerful confirmation tool: a pattern backed by significant trading activity tends to be more reliable. Besides volume, technical indicators like the Relative Strength Index (RSI) or Moving Averages can filter out weak signals. For example, an RSI crossing above 50 in tandem with a morning star pattern strengthens the case for an upward trend.
Setting stop-loss orders based on patterns is a practical way to manage risk. When you enter a trade following a candlestick signal, placing a stop-loss just below the pattern’s low (in bullish cases) or above the high (for bearish scenarios) limits potential losses if the market moves against you. This approach ensures that one bad trade does not wipe out your capital, which is particularly important in volatile markets.
Combining this with your position size keeps risk manageable. For example, a trader buying after a hammer pattern in the PSX might set a stop-loss slightly below the hammer’s wick. This way, if the price drops beyond this point, it signals that the pattern has failed.
Combining candlestick signals with support and resistance levels improves entry decisions even more. Candlestick patterns forming near strong support or resistance lines carry more weight. A bullish engulfing pattern near a historical support level suggests a bounce-back, indicating a good entry point.
Similarly, if a bearish pattern like the evening star appears near a known resistance, it hints at a price drop soon, signalling a possible exit or short position. Recognising these price zones helps you avoid entering trades too early or late, improving your overall win rate.
When you integrate candlestick patterns with volume, indicators, and key price levels, your trading approach becomes more robust and less guesswork-driven.
By focusing on these aspects, traders in Pakistan and beyond gain sharper tools to navigate both the PSX and international markets efficiently.
Candlestick patterns serve as handy guides, but they are far from foolproof. Being aware of their limitations helps you avoid costly errors. Traders who rely heavily on candlestick signals without considering the broader market context often end up chasing false leads. Recognising these pitfalls allows you to use candlesticks more effectively, especially in volatile markets like Pakistan’s stock exchange or currency trading.
Candlestick patterns by themselves don’t guarantee a market move. For example, a bullish engulfing pattern might suggest an upward reversal, but if it occurs in a strong downtrend without volume confirmation, it’s risky to assume a complete turnaround. Traders often get trapped by such setups because they treat patterns like a secret formula rather than part of a bigger puzzle.
On top of that, external factors such as political events, economic data releases, or sudden market news can invalidate candlestick signals instantly. A pattern that looks promising on your chart could be wiped out by a central bank announcement or geopolitical tension. So, relying on candlestick signals alone without considering these variables tends to produce unreliable results.
Context matters a lot when interpreting candlesticks. If the overall market sentiment is bearish, bullish candlestick patterns might be weak or short-lived. Conversely, a bearish pattern in a strong bull market might end up failing. For instance, during periods of heavy loadshedding in Pakistan, market activity slows, sometimes distorting typical price action signals.
It is wise to combine candlestick analysis with technical indicators, volume trends, or fundamental news flow. This wider perspective helps filter out noise and false signals, making your trade entries more dependable. Treat candlestick patterns as one of many tools, not as the sole decision-maker.
Some candlestick patterns look quite alike but signal different outcomes. Take the hammer and the hanging man: both have small bodies and long lower wicks but appear in different market contexts. A hammer at the bottom of a downtrend usually hints at bullish reversal, whereas a hanging man near an uptrend warns of a bearish reversal.
Misreading such subtle differences can lead to wrong trading decisions. It’s important to learn how to spot these nuances clearly and always consider the preceding price action and trend direction. Relying on just the shape without context tends to create confusion and errors.
Candlestick patterns don’t behave the same across all timeframes. A pattern seen on a 5-minute chart may work well for day traders but could be noise for someone investing over weeks or months. For example, a shooting star on an hourly chart may indicate short-term weakness, but the daily chart might still favour an upward trend.
Choosing the right timeframe for your trading style and market is critical. Pakistani traders dealing with fast-moving currency pairs need shorter timeframes, while long-term equity investors benefit from daily or weekly charts. Mixing timeframes without a clear plan can cause misinterpretations and poor timing.
Successful trading depends not just on recognising patterns but understanding their limits and fitting them properly within the market’s bigger picture.
By combining candlestick analysis with solid risk management and market awareness, you improve your chances of making reliable, profitable trades.
📊 Learn key single candlestick patterns in trading that reveal market sentiment fast. Improve your equity, forex & commodity trades with expert insights 📈

📈 Understand key candlestick patterns in Urdu to boost your trading skills. Learn basic and advanced formations with practical tips for Pakistan's stock markets.
📈 Master 35 essential candlestick patterns to boost your trading. Learn how to read charts, spot trends, and make smarter market decisions today!
Learn how price action candlestick patterns reveal market trends for smarter trading decisions 📊. Ideal guide with PDF resources tailored for Pakistani traders 🇵🇰.
Based on 5 reviews