

How to Start Forex Trading in Pakistan
📈 Start forex trading in Pakistan with this practical guide! Learn to pick brokers, set accounts, master strategies, manage risks, and navigate legal rules confidently.
Edited By
Henry Caldwell
Candlestick patterns play a key role in forex trading by providing visual insights into price movements. These patterns help traders in Pakistan, whether beginners or experienced, to understand market sentiment and make better trading decisions.
Originating from Japanese rice traders centuries ago, candlestick charts display the open, high, low, and close prices for a given time period. Each candle consists of a body and wicks (or shadows), representing the price range. The body’s colour indicates whether the price went up (usually green or white) or down (red or black).

By recognising specific formations of single or multiple candlesticks, traders can anticipate potential reversals, continuations, or indecision in the market. This is especially useful in the volatile forex market, where timely decisions matter.
They visualise market psychology clearly.
Provide early warning signals before price moves.
Help confirm entry and exit points.
Combine well with other tools like support/resistance and indicators.
To illustrate, a simple ‘Doji’ pattern, where the candle’s body is very small and wicks are long, signals market indecision—it indicates buyers and sellers are evenly matched. In Pakistan’s forex market, spotting a Doji on the USD/PKR chart near key levels can warn traders to wait before making moves.
Recognising patterns requires practice but learning key ones like Engulfing, Hammer, and Shooting Star can significantly boost your trading edge.
Mastering candlestick patterns equips you to read price action beyond numbers, linking market story and trader behaviour visible in every candle.
Next, we will explore basic candlestick types and their meanings, followed by how to use them with other analysis methods for better trading outcomes.
Candlestick patterns serve as the backbone for many forex traders' decision-making processes. By understanding these patterns, traders can read market sentiment more clearly and make better-informed calls about when to enter or exit trades. This section lays out the essentials of candlestick patterns, highlighting their structure, descriptive price points, and how they differ from other chart types to provide actionable insights.
A single candlestick expresses price action during a specific time frame. It consists of a 'body' and two 'wicks' (or shadows) extending above and below. The body represents the range between the open and close prices, while the wicks show the highest and lowest levels reached. For example, a tall upper wick with a small body can hint that buyers tried pushing prices up but sellers took control, pushing prices back down.
Each candlestick captures these four vital points. The 'open' is the first traded price during that interval, and the 'close' is the last price. The wicks mark extremes—the highest and lowest prices touched. This clarity allows traders to spot momentum shifts quickly. For instance, if the close is significantly higher than the open, it signals bullish strength during that period.
Unlike line charts that connect closing prices or bar charts displaying similar information in different ways, candlesticks offer a visually intuitive view of price dynamics. Their body and shadow sizes can suggest strength, indecision, or reversal signals instantly, which line charts might miss. This visual edge helps Pakistani traders identify changes in market tone faster.
Candlestick patterns reflect the tug of war between buyers and sellers—sometimes showing clear dominance, at times indecision. Patterns like Doji or Hammer reveal moments when market sentiment is shifting. For example, a Doji with equal open and close suggests uncertainty; traders often interpret this as a sign that the current trend may lose steam soon.
Certain candlestick shapes frequently precede price reversals or continuations. Recognising these patterns helps traders anticipate the next move without relying solely on indicators. If you spot a Bullish Engulfing pattern after a downtrend, it often indicates a strong bounce incoming, providing a timely entry signal.
For traders in Pakistan's forex market, where volatility and unexpected swings are common, candlestick patterns offer quick, cost-free clues on market direction. Unlike relying exclusively on complex algorithms or paid signals, these visual tools empower traders to act swiftly and with confidence. Besides, combining candlestick insights with local market factors, such as news on rupee fluctuations or geopolitical events, can enhance trade success.
Understanding both the structure and implications of candlestick patterns allows traders to turn price charts into a story of market behaviour, making their trading decisions much clearer and more grounded.
By mastering these basics, you lay a solid foundation to advance towards recognising more complex patterns and integrating them with other analytical tools for a comprehensive trading strategy.
Single candlestick patterns offer straightforward clues about market sentiment, making them valuable for traders who want quick insights without waiting for multiple bars to form. These patterns reflect immediate buyer-seller dynamics, helping forex traders decide when to enter or exit a trade. For example, spotting a Hammer in a downtrend could signal a potential reversal, prompting careful observation or early position adjustments.
The Standard Doji appears when a candlestick’s opening and closing prices are nearly identical, forming a cross or plus-shaped pattern. This reflects market indecision—buyers and sellers are almost equally matched, creating a pause. In forex trading, a Doji often signals hesitation before a possible reversal or continuation, depending on the preceding trend and volume.
These are special forms of Doji where the shadows take distinct shapes. The Dragonfly Doji has a long lower shadow with little or no upper shadow, indicating strong buying pressure after initial selling. Conversely, the Gravestone Doji shows a long upper shadow but little lower shadow, suggesting selling pressure dominates after an early rally. In practice, a Dragonfly Doji near support zones might hint at bullish reversal, while a Gravestone Doji nearing resistance warns of bearish pullback.

Doji patterns alone don’t guarantee reversals but highlight uncertain market conditions. When appearing at key support or resistance levels, alongside volume spikes or confirming indicators like RSI, they become more reliable signals. For instance, in the PKR/USD pair during a downtrend, a Doji forming at a known support level could alert traders to a possible trend shift, aiding in better risk management.
A Hammer candlestick has a small body near the top of its range, with a long lower wick at least twice the length of the body. It typically emerges after a downtrend and suggests buyers pushed prices up after early selling pressure. Seeing a Hammer in a falling market often means bulls are stepping in, and the selling momentum might be weakening.
Though visually similar to the Hammer, the Hanging Man appears after an uptrend rather than a downtrend. It signals that although prices closed near their highs, sellers tried to push them down significantly during the session. This warns that the bullish trend could be losing steam and a correction or reversal might follow.
Both patterns must be considered in context. A Hammer in a downtrend can prompt traders to watch for bullish confirmation the next day, like a strong green candle. Conversely, a Hanging Man after an upswing might encourage traders to tighten stops or prepare for potential selling. In Pakistani forex markets, such as rupee against the euro, these signals can be combined with news events or macroeconomic data to sharpen trade decisions.
Understanding the nuances of single candlestick patterns equips traders with quick assessment tools for market moods, improving timing and reducing guesswork in volatile forex markets like Pakistan’s.
Dual and multiple candlestick patterns play an important role in forex trading, especially when you want to identify potential trend reversals or continuation signals. Unlike single candlestick patterns that provide limited information, these patterns combine two or more candles to offer clearer insights into market sentiment and price action. This helps traders avoid rash decisions based on one isolated candle and instead base their strategies on a more confirmed signal.
For example, when two or three candles work together to show a distinct shift in buyer or seller strength, it becomes a stronger clue that the market mood is changing. These patterns are especially useful in volatile forex markets like Pakistan’s, where price swings can be sharp and sudden. Recognising these multi-candle formations can improve your trade timing and risk management.
A bullish engulfing pattern happens when a small red (bearish) candle is followed by a larger green (bullish) candle that completely covers or "engulfs" the previous candle’s body. This signals that buyers have taken control after some selling pressure. For instance, if the Pakistani rupee against the US dollar shows this pattern near a support level, it might suggest a reversal to the upside, inviting traders to look for buying opportunities.
The bearish engulfing pattern works the other way round. Here, a small green candle is overtaken by a larger red candle, indicating sellers have overrun buyers. This often appears at the top of an uptrend, warning that the bullish momentum is losing strength. For forex traders keeping an eye on currency pairs like EUR/PKR, spotting this pattern near resistance could mean it's time to consider exiting longs or prepare for a short position.
Engulfing patterns serve as strong confirmation signals because they reflect a clear change in market control. When a bullish engulfing appears after a downtrend or a bearish engulfing after an uptrend, it strengthens the case for a trend reversal. However, these patterns work best when combined with other analysis tools such as support/resistance levels or volume spikes. Traders should avoid relying solely on engulfing candles without context, especially given market volatility in Pakistan.
The morning star and evening star are three-candle patterns signalling strong reversals. A morning star forms after a downtrend and consists of a large bearish candle, a small-bodied candle (which can be bullish or bearish) showing indecision, followed by a large bullish candle. The evening star appears after an uptrend and has the reverse candles: large bullish, indecision candle, and then a strong bearish candle.
These patterns reflect a shift in market psychology. The small-bodied candle in the middle shows hesitation or weakening momentum, which foreshadows a change in direction. Morning stars indicate buyers stepping in after sellers dominated, while evening stars warn of sellers taking over after buyers exhausted themselves. For traders, spotting these can alert them early to prepare for a trend change.
For example, if USD/PKR displays a morning star near a key support level, it can be a strong indication of an upward bounce. Likewise, an evening star forming close to a resistance zone on EUR/USD charts could suggest a pending drop. Such patterns, when backed by volume and other indicators, can help you enter and exit trades more confidently in Pakistan's forex scene, where timing is everything.
Understanding dual and multiple candlestick patterns helps traders make informed decisions by reading the market’s mood more precisely. Such knowledge is crucial when navigating Pakistan’s often sudden forex price movements.
Candlestick patterns alone offer valuable insights, but combining them with other analysis tools greatly enhances a trader's ability to make sound decisions. In forex trading, relying on one method can lead to false signals, especially in volatile markets like Pakistan’s. By layering candlestick patterns with support and resistance levels or popular indicators, traders refine entry and exit points, improving overall strategy.
Support and resistance zones act like price magnets or barriers. When a candlestick pattern appears around these levels, it confirms the strength of the signal. For instance, a bullish engulfing pattern near a well-established support line signals a higher chance of upward movement. Traders should look for such confluence before entering a trade to reduce the risk of false breakouts.
Such confirmation is especially important when trading on lower timeframes where noise is common. Imagine a Hammer candlestick forming just above a support line—it gives a clearer buying signal than the hammer alone. This approach helps in identifying spots where the market is likely to react and reverse.
Timing entry and exit can be tricky with candlestick patterns alone because they reflect potential reversals or continuations, not exact points. Adding support and resistance allows traders to wait for retests or price rejections at these levels before acting.
For example, after spotting a Morning Star pattern at a resistance zone, a trader might wait to see if price retests the zone and confirms that resistance holds. This reduces premature entries and helps in managing risk effectively. In essence, support and resistance give a more disciplined approach to timing trades alongside reading candlestick signals.
Moving averages (MA) smooth out price data, revealing the trend direction. When candlestick patterns occur around key moving averages, such as the 50-day or 200-day MA, it adds weight to their signal. For example, a bullish engulfing pattern above the 50-day MA suggests a stronger uptrend continuation.
In Pakistan’s often choppy forex markets, using moving averages helps traders avoid whipsaws. MA lines act as dynamic support or resistance levels. So, combining a Doji with price bouncing off the 200-day MA can provide a clearer signal for trend change or pullback.
RSI measures the speed and change of price movements, indicating overbought or oversold conditions. When candlestick patterns appear in conjunction with RSI extremes, it confirms market sentiment.
For example, a Hammer candlestick forming while RSI is below 30 (oversold) supports the idea of a potential bullish reversal. Conversely, a Hanging Man pattern near RSI over 70 (overbought) warns of a possible downtrend. Using RSI helps traders avoid chasing price and spot better entry points aligned with momentum.
The Moving Average Convergence Divergence (MACD) indicator tracks momentum and trend changes by comparing two moving averages of price. When MACD crosses or diverges alongside candlestick patterns, it strengthens the trade signal.
Say a Morning Star forms while MACD line crosses above the signal line, it signals growing bullish momentum. This kind of double confirmation is important in markets where sudden spikes or drops happen due to news or economic data releases common in Pakistan’s forex environment.
Combining candlestick patterns with support/resistance and indicators like MA, RSI, and MACD provides a more reliable way to spot entry and exit points, improving trade success and risk management significantly.
Using a blend of these tools gives you an edge over depending on one method. It also helps to adapt to different market phases and conditions, making your forex trading strategy more resilient and effective.
Forex trading in Pakistan presents unique challenges and opportunities. Understanding practical advice helps traders navigate this market effectively, especially when using candlestick patterns. Familiarity with the local economic climate, including currency fluctuations and geopolitical influences, strengthens decision-making. Practical tips ensure you avoid common pitfalls and capitalise on reliable signals, turning patterns into profitable trades.
Markets in Pakistan, especially around major news events or SBP monetary policy announcements, can become very volatile. This volatility often triggers false signals in candlestick patterns. For example, a hammer pattern during a sudden spike might mislead traders to expect a reversal, but continuing momentum can push prices further before settling. Recognising when price action is erratic helps you avoid jumping in prematurely.
Therefore, combining candlestick signals with volume analysis or wider time frames reduces misinterpretation. Always watch for confirmation before acting on a single candlestick in a volatile session.
Candlestick patterns do not operate in isolation. Ignoring broader market trends or macroeconomic factors can lead to wrong conclusions. For instance, a bullish engulfing pattern during a strong downtrend may not necessarily signal an immediate uptrend but rather a temporary pullback.
In Pakistan’s forex market, events like political developments or changes in import/export tariffs heavily influence trend direction. Candlestick patterns should be weighed alongside such factors to avoid erroneous trades.
Pakistani traders rely on accessible charting platforms like MetaTrader 4 (MT4), TradingView, and Pakistan-based brokerage software. These platforms offer real-time candlestick charts with customisable tools. MT4, for example, supports automated pattern recognition plugins, helping traders spot patterns quickly.
Choosing a platform that supports Urdu or local language interfaces can make analysis smoother for many traders. Moreover, Pakistani-specific forex brokers often provide tailored charting and local language customer support.
To sharpen pattern recognition skills, several online courses and books focus on candlestick trading. Platforms like Investopedia, local trading academies in Karachi and Lahore, and YouTube tutorials tailored for Pakistani traders provide practical lessons.
Additionally, look for courses explaining integration of candlestick patterns with technical indicators common in Pakistan, such as RSI or Bollinger Bands. Continuous learning through webinars and workshops keeps traders updated on market nuances.
Practice in a risk-free environment is vital. Pakistani brokers generally offer demo accounts with virtual funds allowing traders to test candlestick strategies without financial risk. For example, one can simulate trades on currency pairs like USD/PKR or EUR/USD to understand pattern reliability under different market conditions.
Regular demo trading helps develop confidence in identifying genuine signals versus noise. It also enables adapting strategies to Pakistan’s distinctive market behaviour before committing real capital.
Practical knowledge combined with experience is key. Using trusted resources and staying aware of market context minimises losses and enhances your edge when trading forex with candlestick patterns in Pakistan.
📈 Start forex trading in Pakistan with this practical guide! Learn to pick brokers, set accounts, master strategies, manage risks, and navigate legal rules confidently.
Discover how to choose the best forex trading platform for Pakistani traders 🇵🇰. Compare features, fees, and tools to succeed in Pakistan’s forex market 📈.

Discover how to pick the best forex trading apps in Pakistan 📱. Learn about essential tools, regulations, and tips to trade smarter on mobile platforms.
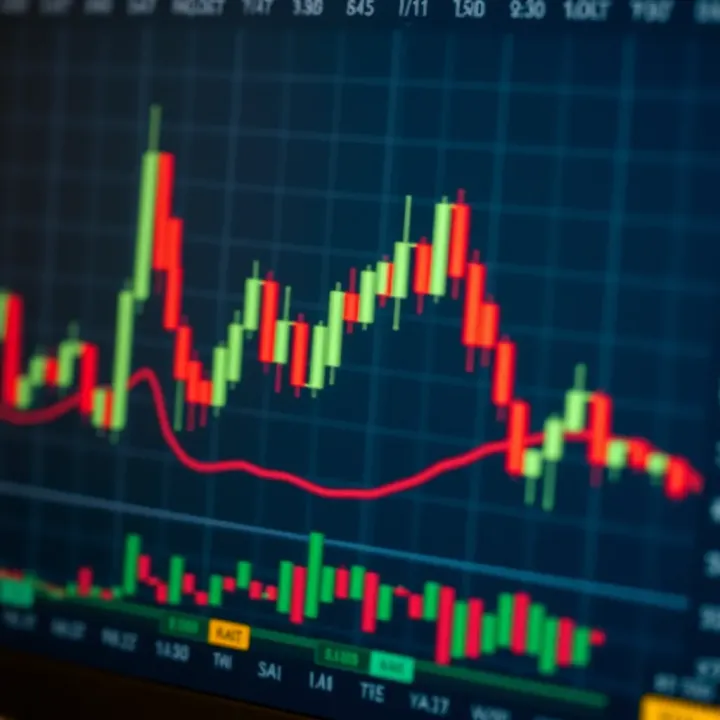
📈 Master 35 essential candlestick patterns to boost your trading. Learn how to read charts, spot trends, and make smarter market decisions today!
Based on 14 reviews