
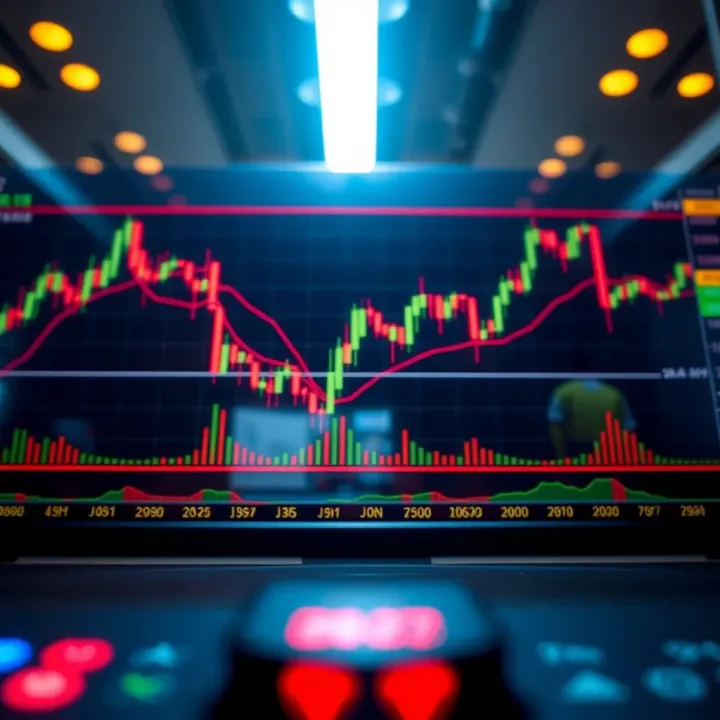
Bearish Candlestick Patterns Explained
📉 Learn how bearish candlestick patterns signal market drops, helping traders in Pakistan spot trends, manage risks, and improve timing in trades.
Edited By
Oliver Bennett
Candlestick patterns have secured a vital place in technical analysis for traders around the world, including Pakistan. These patterns offer a visual snapshot of market sentiment and price action, allowing traders to anticipate potential moves without relying only on numbers and indicators. Learning to read these patterns can improve your timing and confidence when making trading decisions.
A candlestick chart displays price movements in distinct bar shapes, each comprising a body and shadows (wicks), which capture the open, close, high, and low within a given time frame—be it minutes, days, or weeks. The colour and size of each candle provide clues about the market's mood, whether bullish or bearish. For example, a long green candle followed by a small red one might suggest a pause or reversal, information that’s critical for entry and exit points.

Popular books like Steve Nison’s Japanese Candlestick Charting Techniques and Thomas Bulkowski’s Encyclopedia of Candlestick Charts give readers both the fundamentals and nuances of various patterns. These include classic formations like the Doji, Hammer, Engulfing, and Morning Star. Each pattern carries a story about buying and selling pressure, which traders combine with volume and trend analysis to enhance accuracy.
For Pakistani traders, understanding candlesticks is especially useful due to the volatile nature of local markets like the Pakistan Stock Exchange (PSX) and currency fluctuations related to the rupee. Besides equities, candlestick patterns apply well in Forex and commodity trading, where swift decisions are necessary.
Mastering candlesticks isn’t about memorising patterns blindly but integrating them with overall market context and one’s trading style.
Keep in mind that no pattern guarantees profits, but these visual cues offer a strategic edge. This article draws from key books respected worldwide, highlighting their practical takeaways to help you read charts more effectively and make smarter moves in Pakistan’s financial markets.
Candlestick charts are fundamental tools in trading and investing, offering a clear visual representation of market sentiment. Understanding these charts is essential because they translate complex price movements into intuitive shapes and colours. This makes it easier to spot trends, reversals, and potential entry or exit points, especially for those trading on the Pakistan Stock Exchange (PSX) or the forex market.
Candlestick charting has its roots in 18th-century Japan, where rice traders used it to track market behaviour. Munehisa Homma, a legendary rice merchant, is credited with developing this method. Though centuries old, its relevance persists today due to its ability to reflect human psychology during trading sessions. For Pakistani traders, knowing the history adds appreciation of how timeless and effective this tool is, bridging traditional markets to modern ones.
Each candlestick represents price movement within a specific timeframe—minutes, hours, days, or weeks. It consists of a body that shows the open and close prices and wicks (or shadows) that indicate the highest and lowest points during that period. The body’s colour—typically green (or white) for price increases and red (or black) for declines—quickly informs traders about the session’s outcome. For example, a tall green candlestick in PSX daily charts signals strong buying momentum.
Traders value candlestick patterns because they provide a quick snapshot of buying and selling forces in the market. Unlike raw numbers, these patterns reveal shifts in momentum that can hint at future price moves. Pakistani traders especially find this useful when dealing with intraday volatility or reacting to breaking news affecting local companies.
The visual nature of candlesticks enables traders to catch scenes of the market drama—who's winning, who's losing, and when shifts might happen—much faster than line charts.
Compared to traditional line charts, candlestick charts offer more detailed information since they include open, close, high, and low prices for each period. Unlike bar charts, candlesticks enhance readability with colour coding and distinct shapes, making pattern recognition easier. This advantage matters when watching PSX or forex charts where time-sensitive decisions are crucial. Although volume bars and other indicators complement them, candlesticks remain central for a quick but thorough market assessment.
In short, candlestick charts give traders a practical and visual edge in analysing price movements, helping them to make informed trading decisions with greater confidence.
Candlestick patterns are crucial tools traders use to understand market sentiment and make informed decisions. These patterns reflect the battle between buyers and sellers over a specific period, often revealing potential price movements. Recognising and interpreting key candlestick patterns can give Pakistani traders a solid edge, especially in markets like the Pakistan Stock Exchange (PSX) or forex trading using Pakistan rupees.
The hammer appears after a downtrend and suggests a potential reversal towards bullishness. It has a small real body, a long lower shadow, and little or no upper shadow. This indicates sellers pushed prices down during the day, but buyers regained control by the close. An inverted hammer, meanwhile, has a long upper shadow with a small real body near the low. It often hints at buying pressure despite recent selling. For example, if a PSX-listed stock forms a hammer at strong support near Rs 50, this might signal a buying opportunity.
This pattern occurs when a small bearish candle is followed by a larger bullish candle that completely engulfs it. It shows a clear shift from seller dominance to buyer control, making it a reliable reversal signal. Traders often look for bullish engulfing patterns during corrections in an uptrend to find entry points. For instance, forex traders dealing in USD/PKR might see this pattern emerge after a dip, prompting a long position.

The shooting star forms after an uptrend and signals a possible bearish reversal. This single candle has a small real body near the day's low and a long upper shadow, suggesting buyers pushed prices higher but lost momentum by the close. On the PSX, if a stock rallies sharply and then forms a shooting star near resistance, it might indicate profit-taking ahead.
This pattern is the bearish counterpart of the bullish engulfing. It features a smaller bullish candle followed by a larger bearish candle that engulfs it entirely. It points to strong selling pressure and potential price declines. Traders often use this signal to prepare exit strategies or take short positions, especially in volatile markets like commodity trading in Pakistan.
Doji candles form when opening and closing prices are nearly equal, reflecting indecision between buyers and sellers. Similarly, spinning tops have small bodies with longer shadows. These patterns alone don’t predict direction but signal that market momentum may be shifting. In the Pakistani market context, spotting a doji after a strong rally might signal consolidation or an upcoming reversal.
The three white soldiers pattern consists of three consecutive long bullish candles, showing sustained buying pressure and a strong uptrend continuation. Conversely, three black crows are three consecutive bearish candles indicating persistent selling. These patterns help traders confirm trend strength and decide whether to add to positions or exit. For example, if a large chemical company listed on PSX shows three white soldiers after a correction, it might attract buyers expecting further gains.
Understanding these patterns helps Pakistani traders time entries and exits more accurately, reducing guesswork in volatile markets. They become more confident managing risks in local equities and forex trading.
By combining candlestick patterns with local market knowledge, traders can navigate Pakistan’s unique trading environment with better foresight and strategy.
Candlestick patterns offer valuable insights about market sentiment, but they work best when combined with other trading tools. Using patterns alone can give false signals, so confirming them with volume and technical indicators sharpens your decision-making. Plus, setting clear entry and exit points based on these patterns helps manage risks effectively.
Volume acts like a stamp of approval on candlestick signals. For example, a bullish engulfing pattern on high volume indicates stronger buying interest compared to the same pattern on low volume. If a reversal pattern forms but trading volume remains weak, it’s safer to stay cautious. Volume confirms the conviction behind price movements, helping traders avoid fake breakouts or sudden reversals.
In the Pakistan Stock Exchange (PSX), high volume spikes often precede major price moves, especially in sectors like banking or energy. Monitoring volume alongside patterns allows traders to better time their entries or exits, reducing guesswork.
Moving averages smooth out price fluctuations and reveal trend direction. Combining candlestick patterns with moving averages helps confirm if a signal fits the broader trend. For instance, spotting a hammer pattern near a long-term moving average offers a stronger buy signal than one appearing randomly.
The Relative Strength Index (RSI) adds a layer of momentum analysis. Overbought or oversold readings combined with reversal patterns enhance signal reliability. A shooting star forming when RSI reads above 70 points to a likely reversal, while a bullish engulfing paired with RSI below 30 signals a rebound. These indicators filter out noise and fine-tune trade timing.
Using candlestick patterns to set stop-loss levels guards your capital against sudden downturns. For example, after identifying a bullish engulfing pattern, placing your stop-loss just below the pattern’s low provides a logical exit point if the trade fails. This approach ensures you don’t get shaken out by normal market swings but limits potential losses.
Stop-losses can be tight or loose based on your risk appetite and asset volatility. In fast-moving Pakistani markets, giving a bit more room around key support or resistance levels helps avoid premature stop-outs while controlling downside.
Estimating targets using candlestick patterns relies on measuring recent price moves and anticipating continuation or reversal strength. Traders often project a target at the height of the previous rally or calculate risk-reward ratios around 2:1 or 3:1.
For instance, a bullish three white soldiers pattern on a WAPDA shares chart suggests sustained momentum. In such cases, setting target prices near historic resistance zones helps lock in profits. Combining targets with trailing stops enables you to protect gains while riding strong trends.
Always remember, patterns tell a story but they don’t guarantee outcomes. Matching them with volume, indicators, stop-loss, and targets improves trade discipline and results.
Finding the right resources is essential for mastering candlestick patterns, especially for Pakistani traders and analysts looking to sharpen their market strategies. Books that provide clear examples and practical insights can make a real difference in understanding price action and market psychology. This section discusses two highly regarded classics and their distinctive features, along with the availability of such books in Pakistan.
'Japanese Candlestick Charting Techniques' by Steve Nison is widely regarded as the cornerstone for anyone serious about learning candlestick analysis. Nison’s book demystifies complex patterns by tying them to real trading examples, which is useful for Pakistani readers interested in both the domestic equities market and forex trading. The book breaks down the essence of candlestick construction, focusing on the psychology behind price movements, which helps traders anticipate shifts more accurately.
What makes Nison’s work stand out is its hands-on approach. Readers will find detailed descriptions of key patterns like Hammers, Dojis, and Engulfing formations, alongside advice on how to combine these with volume and other technical tools. This guidance aids in making more informed entry and exit decisions, reducing guesswork, which is critical in Pakistan’s often volatile market environment.
'Encyclopedia of Candlestick Charts' by Thomas Bulkowski offers an exhaustive reference suitable for traders aiming to deepen their understanding beyond basic patterns. Bulkowski compiles a broad array of candlestick formations, supported with statistical performance data gathered from extensive backtesting. Pakistani readers benefit from this quantitative style as it provides probabilities and expected outcomes, helping manage risk effectively.
This book also includes ranking and failure rates for patterns, assisting traders in prioritising which signals to trust more in fast-moving situations like PSX trading sessions or currency markets. Though bulkier than more introductory texts, its organised layout and case studies make it a valuable resource for serious market participants.
Availability in Pakistan Bookstores is improving gradually, with major outlets in Karachi, Lahore, and Islamabad stocking popular trading titles including those by Nison and Bulkowski. Local bookstores often import these books, allowing access to physical copies that many prefer for detailed study. Some shops in Saddar Karachi and Liberty Market Lahore specialise in financial literature, making them good starting points.
However, prices can be on the higher side due to import costs, so readers might want to compare options before buying. Collectors and aspiring traders often keep an eye on second-hand book markets and special sales during event seasons such as Eid or Defence Day, when discounts are more frequent.
Online Access and Digital Editions now offer more affordability and convenience, especially for younger traders and students. Platforms like Kindle and other e-book vendors provide affordable digital versions of these classic works, which you can access instantly. This is particularly suitable for traders balancing studies or work, enabling study on mobile devices or laptops without the bulk of a physical book.
Many websites also offer PDFs or summary guides of key candlestick concepts, though it’s advisable to stick with official editions to avoid inaccuracies. Some Pakistan-based financial education platforms provide translated materials or locally relevant examples alongside digital books, helping bridge cultural and market-specific gaps.
For Pakistani readers, combining classic teachings with locally accessible resources provides a practical path to mastering candlestick patterns. Whether through a well-structured book or digital edition, informed reading underpins more confident trading decisions in Pakistan's evolving markets.
Mastering candlestick reading is essential for making informed trading decisions. Practice helps sharpen your ability to spot patterns quickly and understand their implications in real market situations. For readers in Pakistan, the relevance of practising with local examples cannot be overstated. The stock market (Pakistan Stock Exchange - PSX) and Forex trading offer practical environments where candlestick patterns directly influence price movements.
Demo accounts let you experiment without risking real money, which is ideal for newcomers. Several Pakistani brokers and platforms offer demo accounts for PSX shares and Forex pairs such as USD/PKR. These trial accounts reproduce live market conditions allowing you to apply knowledge from candlestick books and notice how patterns like the Hammer or Engulfing develop under different volatilities. This hands-on approach sharpens decision-making skills and builds confidence.
Familiarity with patterns is easier when you observe them in local stocks such as OGDC, HBL, or Lucky Cement. Pakistani equities may behave differently due to local news, economic policies, or market sentiment influenced by things like PKR fluctuations or government budgets. Tracking charts for these companies helps you understand context-specific nuances, such as how candlestick patterns react around earnings announcements or after interest rate changes by the State Bank of Pakistan.
One common pitfall is waiting for a single candlestick pattern to dictate your trade. Relying solely on a Hammer or Doji without considering volume, support-resistance levels, or overall trend can lead to misleading signals. For instance, a Bullish Engulfing in a strong downtrend might not guarantee a reversal. Combining candlestick insights with other technical tools reduces false alarms and improves trade accuracy.
Candlestick patterns do not operate in isolation; ignoring the broader market context weakens their effectiveness. A Shooting Star during a volatile session caused by political news or economic data release may not carry the usual bearish weight. Understanding underlying factors like news flow, market sentiment, and macroeconomic events relevant to Pakistan’s markets is critical when interpreting these patterns.
Regular practice using demo accounts and tracking real-world Pakistani market examples helps master candlestick reading. Always combine pattern signals with other analysis tools and never overlook the market environment to improve trading success.
📉 Learn how bearish candlestick patterns signal market drops, helping traders in Pakistan spot trends, manage risks, and improve timing in trades.
📈 Master candlestick patterns from single to complex forms to better read market psychology and predict price moves in Pakistani and global markets.

📈 Master advanced candlestick patterns for smarter trading! Get practical tips, quick recognition tricks, and in-depth insights to improve your market analysis today.
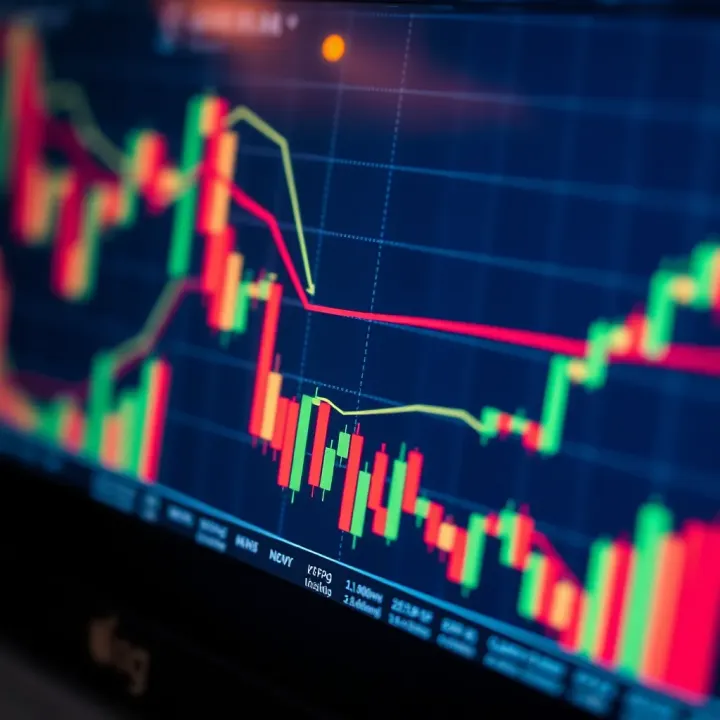
📊 Learn key single candlestick patterns in trading that reveal market sentiment fast. Improve your equity, forex & commodity trades with expert insights 📈
Based on 7 reviews