
Price Action Chart Patterns Explained with PDFs
📈 Learn to spot and read key price action chart patterns for smarter trading decisions. Get practical tips and PDF resources to improve your market understanding in Pakistan.
Edited By
Isabella Reed
Price action candlestick patterns offer a straightforward way to read the market without relying on complicated indicators. These patterns visually represent the battle between buyers and sellers during a specific time frame, helping traders anticipate the next price move.
Each candlestick consists of a body, showing the opening and closing prices, and wicks (or shadows) that highlight price extremes. Recognising patterns that form through one or more candlesticks can give traders valuable clues about market direction, shifts in momentum, or possible reversals.
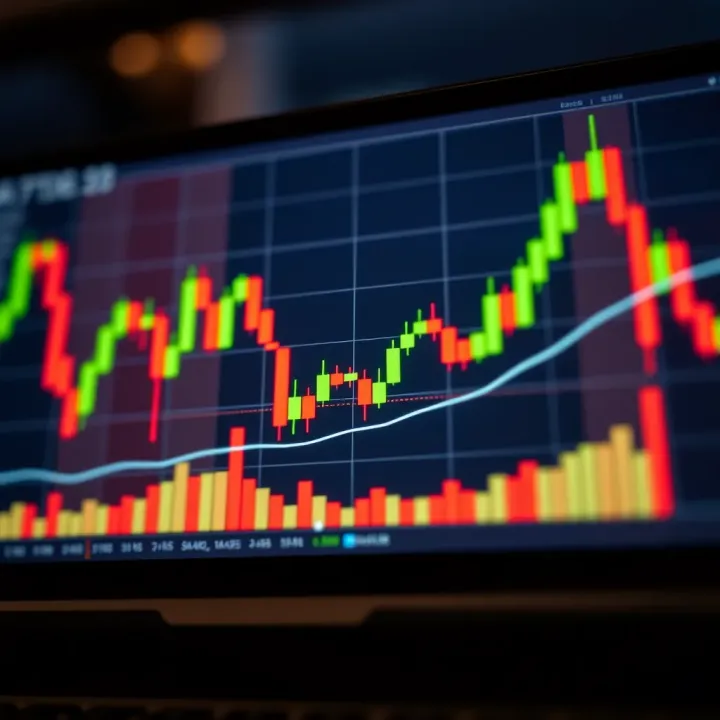
For example, a Bullish Engulfing pattern occurs when a smaller red candle is followed by a larger green candle that ‘engulfs’ the previous one. This suggests buyers have taken control and prices might rise. On the other hand, a Bearish Pin Bar shows rejection of higher prices, signalling a potential downturn.
Pakistani traders often find these patterns useful for local markets like the PSX (Pakistan Stock Exchange) or even forex trading through platforms like MT4 or MT5. Simple pattern recognition can save time and reduce reliance on lagging indicators.
Understanding a handful of reliable candlestick patterns can sharply improve entry and exit timings in trading without overcomplicating strategies.
Doji: Shows indecision when open and close price are nearly the same.
Hammer and Hanging Man: Indicates possible bullish or bearish reversal depending on context.
Engulfing Pattern: A powerful sign of momentum change.
Inside Bar: Reflects consolidation before a breakout.
Traders should combine candlestick patterns with support and resistance levels or trendlines for better reliability. For instance, spotting a Hammer at a historical support level can increase confidence that price might bounce.
Using well-organised PDF resources specifically tailored for Pakistani markets will help traders deepen their knowledge and avoid misinformation. Reputable trading books or courses accessible locally can guide in step-by-step understanding.
Getting comfortable with these patterns helps traders avoid guesswork, offering a clear visual language to understand price behaviour. This approach suits beginners and seasoned investors, making it an essential skill for effective trading decisions in Pakistan’s dynamic markets.
Understanding price action and candlestick patterns is essential for anyone serious about trading. These tools offer a straightforward way to interpret market behaviour without relying heavily on complex indicators. In practical terms, price action reveals the raw buying and selling activity, while candlestick patterns visually capture this action, helping traders anticipate possible market moves.
Defining price action: Price action refers to the movement of an asset's price over time, analysed directly without extra indicators. It is about observing how prices change due to supply and demand forces. For instance, if a stock shows a consistent pattern of higher highs and higher lows, it suggests buyers are in control. This kind of hands-on reading allows traders to react to real-time market sentiment, capturing entry and exit points more precisely.
Role in technical analysis: Within technical analysis, price action serves as the foundation. Indicators like moving averages or the RSI interpret past price changes, but price action itself is the purest form of market data. Relying on it helps traders avoid lagging signals and reduce false alarms. For example, when price action breaks a key support level with strong momentum, it signals a likely trend reversal more reliably than when an indicator slowly crosses its threshold.
Candlestick anatomy: Each candlestick shows four main points: open, close, high, and low prices within a chosen timeframe. The 'body' reflects the range between opening and closing prices, while 'wicks' or 'shadows' mark the extremes. If the closing price is higher than the open, the candlestick typically appears white or green, signalling bullish sentiment; if lower, it appears black or red, signalling bearish sentiment. This visual design provides an instant snapshot of market dynamics for the period.
Difference from other chart types: Unlike simple line charts, which only plot closing prices, candlestick charts add depth by showing how prices moved during the entire period. Compared to bar charts, candlesticks are easier to read quickly because of the clear colour coding and shape variations. For example, spotting a hammer or doji becomes fast and intuitive, helping traders make swift decisions in volatile markets like Pakistan's stock exchange (PSX) or forex trading rooms.
Candlestick charts bridge the gap between raw price data and actionable insights, making them invaluable for price action traders.
In summary, getting comfortable with price action and candlestick charts equips traders to respond better to market shifts, improving accuracy in reading trends and spotting reversal points. This foundation sets the stage for identifying specific patterns and making smarter trading decisions.
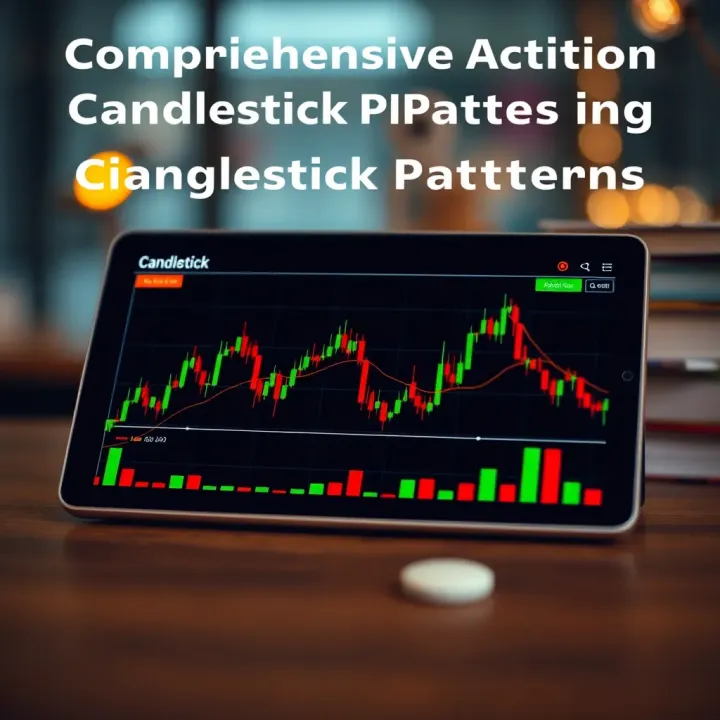
Recognising key candlestick patterns helps traders understand market sentiment and make informed decisions. These patterns show how buyers and sellers battle it out during a trading session, offering clues about potential price moves. Practical knowledge of these patterns, backed by real examples, can guide entry, exit, and stop-loss placement—actions crucial to managing risk and maximising gains.
A Doji forms when the opening and closing prices are almost the same, resulting in a thin or non-existent body, with long wicks on either side. This pattern suggests uncertainty in the market — neither buyers nor sellers managed to take control. For example, a Doji appearing after a strong uptrend might indicate the momentum is weakening, signalling traders to prepare for a possible reversal or consolidation.
In Pakistani markets, spotting a Doji near key support or resistance levels can alert you to pause before placing trades. However, relying on a Doji alone without confirmation (like volume surge or a following candlestick) can be misleading, so always seek additional signals to avoid false alarms.
Hammers and Hanging Man patterns share a similar shape: a small body near the top of the candle with a long lower wick. The difference lies in the context. A Hammer forms after a downtrend, suggesting a potential bullish reversal as buyers step back in. For instance, if you see a Hammer on the PSX 100 index chart after several days of decline, it could hint the market is finding support.
In contrast, the Hanging Man appears after an uptrend and warns of possible weakness. It shows sellers pushed prices lower during the session but buyers managed to close near the open—though this battle may soon tilt in favour of sellers. Pakistani traders should look for confirmation, such as lower closes afterwards, before acting on these patterns.
Engulfing patterns involve two candles where the second completely covers the first. A bullish engulfing happens when a small bearish candle is followed by a larger bullish candle that 'engulfs' it, signalling a strong shift to buying pressure. Conversely, a bearish engulfing pattern appears when a big bearish candle overtakes a preceding smaller bullish candle, indicating sellers might dominate soon.
For example, during volatile trading in Karachi Stock Exchange, a bullish engulfing near a support zone can signal a good time to enter a long position. Traders must also check accompanying volume; higher volume makes the pattern more reliable.
These three-candlestick patterns provide clearer reversal signals. A Morning Star appears after a downtrend: it starts with a long bearish candle, followed by a small-bodied candle showing indecision, then a strong bullish candle confirming upward momentum. This pattern helps Pakistani traders spot potential trend reversals early.
The Evening Star is the bearish counterpart, hinting at a top after an uptrend. It signals a shift from buying enthusiasm to selling pressure over three sessions. Watching for these stars on commodity charts, like oil or cement stocks listed in Pakistan, can assist in timing exits or short entries.
Understanding these candlestick patterns and their meanings lets you interpret market behaviour more clearly, reducing guesswork and improving your trading edge.
By consistently applying this knowledge alongside other technical tools, you can better navigate the ups and downs of Pakistani financial markets and beyond.
Recognising candlestick patterns alone doesn't guarantee profitable trading. The true skill lies in reading these patterns within the right market context and confirming their signals with other indicators. This approach helps avoid false signals and improves entry and exit timing. For example, spotting a hammer candlestick at a strong support level, coupled with rising volume, is more reliable than viewing the hammer in isolation.
Volume shows the number of shares or contracts traded during a given period, making it a vital confirmation tool when analysing candlestick patterns. For instance, a bullish engulfing pattern backed by high volume suggests strong buying interest, confirming the pattern’s potential to signal an upward move. Conversely, if the same pattern occurs on low volume, it could be a weak signal, easier to dismiss as market noise.
Volume spikes around key patterns are especially meaningful in volatile Pakistani markets where retail participation varies widely. Traders can look for volume surges alongside patterns like doji or morning star to validate genuine reversals or breakouts.
Support and resistance levels act as decision points where price behaviour tends to react predictably. Reading candlestick patterns near these levels enhances the signal’s reliability. For example, a shooting star formed near a strong resistance level often indicates sellers overpowering buyers, hinting at a possible reversal.
In the busy bazaars of Karachi or Lahore stocks, these levels reflect psychological price barriers. Pakistani traders should remember that candlestick signals form the best ‘actionable insight’ when they line up close to these predetermined price floors or ceilings. Ignoring this can lead to mistimed trades and unnecessary losses.
Candlestick patterns provide clear visual cues if market sentiment skews bullish or bearish. Patterns with long lower shadows, like hammers, generally indicate buyers stepping in, signalling bullish pressure. In contrast, patterns such as hanging man or shooting star suggest bearish pressure after upside moves.
Pakistani traders watching the PSX or commodity markets should pay close attention to the body size and shadow lengths as they depict conviction strength. A small-bodied Doji with long shadows running through a downtrend can warn of hesitation or possible reversal, but confirmation with volume and other indicators is necessary.
Candlestick patterns help mark logical points to enter or exit trades. For example, a bullish engulfing candle breaking above a recent resistance with increasing volume can be a good entry signal for a long position. On the other hand, spotting a double top pattern with bearish candlesticks and declining volume might suggest considering exit from a long trade.
Traders should combine these signals with stop-loss placement just beyond recent swing highs or lows to guard against sudden reversals. In Pakistan’s market context, where volatility and news impact can be sharp, relying on these clear entry-exit markers saves capital and improves trade discipline.
Candlestick reading is not just about spotting patterns but interpreting them within volume, support-resistance, and broader market context. This layered approach helps Pakistani traders make more confident and timely decisions.
By putting emphasis on confirmation and context, your candlestick trading becomes more precise, reducing guesswork and increasing the chance of consistent profits.
Learning candlestick patterns through PDFs and other resources is practical for traders and investors who want structured and detailed material at their fingertips. PDFs serve as offline handbooks that one can turn to anytime, especially when internet access is intermittent — a common situation in many parts of Pakistan. Besides, they allow learners to follow lessons at their own pace, making complex concepts easier to digest.
Easy to access and carry
PDF guides can be saved on mobile devices, laptops, or even printed for convenient study anywhere — whether waiting during loadshedding or during a commute on a Careem ride. Unlike lengthy videos or online courses, PDFs do not require continuous internet, so they’re especially handy for traders in smaller cities with patchy connectivity.
Structured learning material
These guides are usually organised logically, starting from basics to advanced patterns, helping learners build knowledge step-by-step without confusion. For instance, a well-laid-out PDF will begin with single candlestick patterns before moving into combinations like engulfing patterns, aligning with how traders naturally progress. This helps in retaining the concepts clearly and applying them efficiently in real trading situations.
Sources suitable for Pakistani traders
Look for PDFs that reference regional trading platforms such as PSX (Pakistan Stock Exchange) or mention local market examples. PDFs created by Pakistani financial education platforms, or endorsements by registered institutions like SECP (Securities and Exchange Commission of Pakistan), can provide relevant context. Such resources often address trading peculiarities in our markets, including effects of rupee fluctuation or regulations impacting volume and volatility.
What to look for in a reliable PDF
A trustworthy PDF should include well-explained candlestick charts with annotated examples, clear definitions, and recommended strategies that avoid over-promising. Beware of materials that rely on vague jargon or simplistic claims without evidence. Quality PDFs often have trader testimonials, updated content reflecting current market trends, and pointers for combining candlestick patterns with other technical indicators for confirmation.
Having a good PDF guide turns scattered market information into actionable knowledge, helping you avoid costly mistakes and trade more confidently.
When chosen carefully, PDF resources become essential tools for traders who want to master price action candlestick patterns while fitting learning into their busy routines.
📈 Learn to spot and read key price action chart patterns for smarter trading decisions. Get practical tips and PDF resources to improve your market understanding in Pakistan.
📊 Learn key single candlestick patterns in trading that reveal market sentiment fast. Improve your equity, forex & commodity trades with expert insights 📈
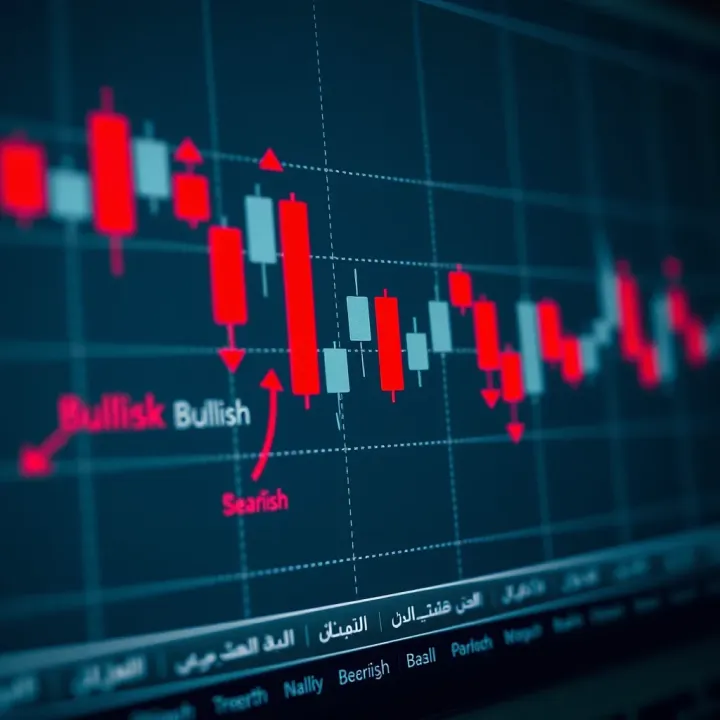
📈 Understand key candlestick patterns in Urdu to boost your trading skills. Learn basic and advanced formations with practical tips for Pakistan's stock markets.
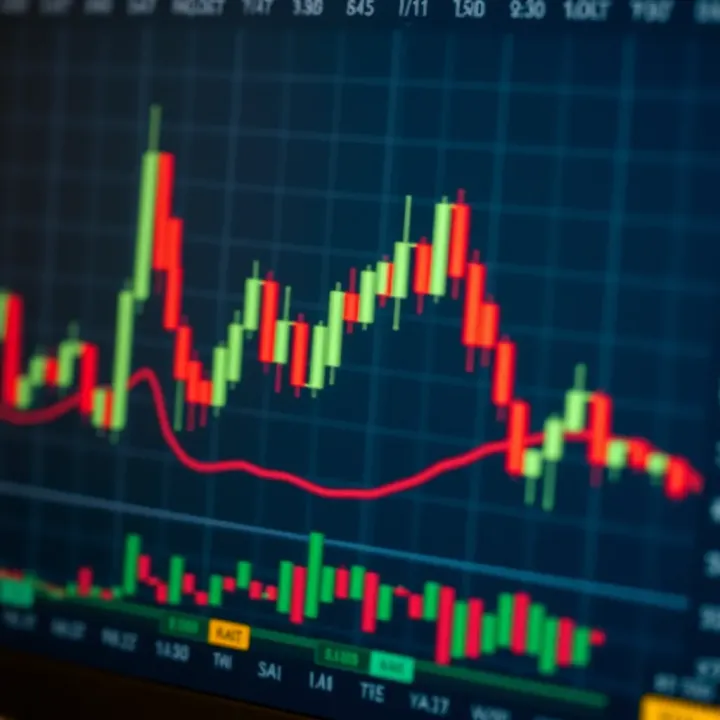
📈 Master 35 essential candlestick patterns to boost your trading. Learn how to read charts, spot trends, and make smarter market decisions today!
Based on 9 reviews