

Understanding Binary Meaning in Urdu
Learn the meaning of binary in Urdu 🖥️. Understand how it applies in computing, math, daily life, and related terms for Urdu speakers interested in tech and language.
Edited By
Liam Prescott
Candlestick patterns are essential tools that traders and investors use to understand market movements. These visual formations on price charts convey the battle between buyers and sellers, often signalling potential reversals or continuations. In Pakistan's equity and currency markets, recognising these patterns helps you make informed decisions rather than just relying on luck.
Candlesticks display four key data points for any trading period: opening price, closing price, highest price, and lowest price. This compact information paints a clear picture of market sentiment within that timeframe. For example, a long green (or white) candle shows strong buying pressure, whereas a long red (or black) candle indicates heavy selling.
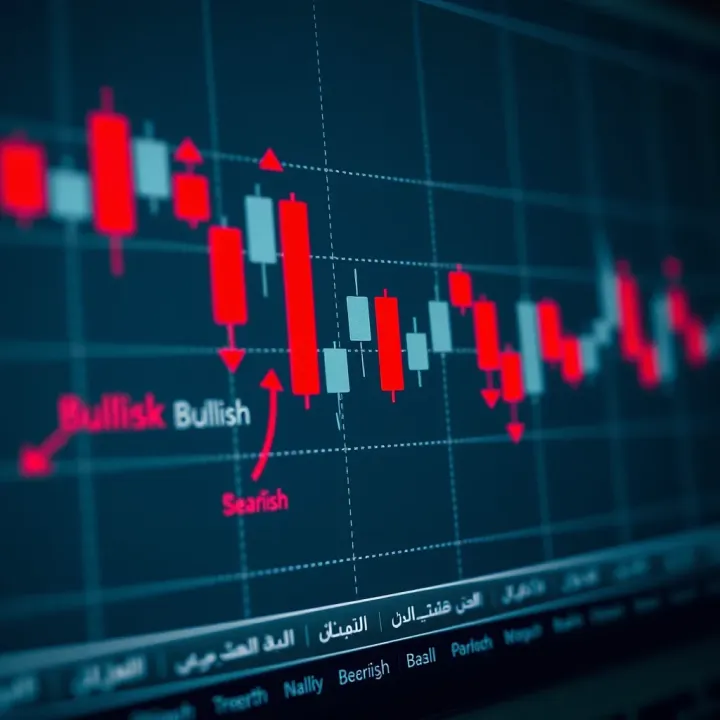
Recognising common candlestick patterns can greatly improve timing your trades, especially during volatile sessions in markets like PSX or the forex market.
Here are some widely used patterns every trader should know:
Doji: When opening and closing prices are almost equal, signalling indecision.
Hammer: A candle with a small body and a long lower wick suggesting possible bullish reversal.
Shooting Star: Small body with a long upper wick, often hinting at a bearish turn.
Engulfing Patterns: A larger candle completely covers the previous one, showing stronger momentum shifts.
Practical use of these patterns involves combining them with volume data and overall trend direction. For instance, spotting a hammer near a support level with increased trading volume can signal a good entry point.
Additionally, using candlestick patterns in conjunction with Pakistani market news, economic indicators, and institutional activity helps avoid false signals. Traders often download Urdu language PDFs and tutorials to get familiar with these formations considering local market nuances.
Understanding these basics sets a foundation for more advanced formations and strategies, essential for trading in Pakistan's unique market conditions. This knowledge not only helps in stock trading but also in commodities and currency trading, where price action speaks louder than any other indicator.
Candlestick patterns form a foundational tool for traders and investors, especially when trying to understand price movements in any market. They offer a visual representation of price action over specific time frames, making it easier to spot trends and possible reversals. For Pakistani traders dealing with the Pakistan Stock Exchange (PSX) or foreign exchanges, these patterns simplify complex market data into manageable insights.
Candlestick charts trace back to 18th-century Japan, originally developed to help rice traders monitor price trends and market sentiment. Munehisa Homma is credited for refining these charts, which combined price movement and psychology effectively. Though created centuries ago, their relevance persists today, offering a simple yet powerful way to read markets.
A single candlestick consists of three main parts: the body, the wick (or shadow), and the colour. The body represents the difference between the opening and closing prices. If the closing price is higher, the candle is typically green (bullish); if lower, it's red (bearish). The wicks show the highest and lowest prices during that period. Understanding these basics helps you gauge market strength quickly.
Unlike line charts that only show closing prices, candlestick charts provide a fuller picture by including opening, high, low, and close prices for each time frame. This richer data helps identify market sentiment more accurately. Pakistani traders who rely solely on line charts might miss subtle signals that candlestick patterns reveal, such as indecision or strong momentum.
Candlestick patterns serve as visual clues to market psychology. By studying these, traders can identify potential trend reversals or continuations, helping them time their trades more effectively. These patterns complement other analysis methods like moving averages or volume, making market reading more holistic.
Patterns such as the Doji, Hammer, or Engulfing give an early warning about price changes. For instance, a Hammer at a downtrend's bottom signals a potential bullish reversal, suggesting it might be time to buy or hold. Pakistani traders, especially in volatile markets like PSX, can benefit from this early insight to protect capital.
Local market conditions often involve sudden shifts due to political or economic news. Candlestick patterns help interpret these changes quickly. Since trading platforms like PSX now offer candlestick charting, learning these patterns in Urdu makes trading more accessible. Understanding these guides traders in managing risk better, especially during festivals or announcement days when volumes spike.
Familiarity with candlestick patterns empowers you to make timely, informed decisions rather than guessing market moves. This is especially useful in Pakistan's dynamic trading environment.
Candlestick patterns form the foundation of technical analysis for many traders worldwide, and Pakistani traders are no exception. Understanding common patterns helps you quickly identify potential price movements and adjust your strategies accordingly. These patterns provide clear visual cues about market sentiment, making it easier to decide when to enter or exit a trade. For example, recognising a reversal pattern early can save you from losses or help you lock in profits before the market turns.
A Doji candle appears when the opening and closing prices are nearly the same, indicating indecision in the market. This pattern often signals a potential reversal or pause in trend. In the context of PSX trading, spotting a Doji after a long uptrend might hint that bullish momentum is fading, and a correction could follow. However, a Doji alone is not enough; confirmation from the next candle or volume changes strengthens its relevance.
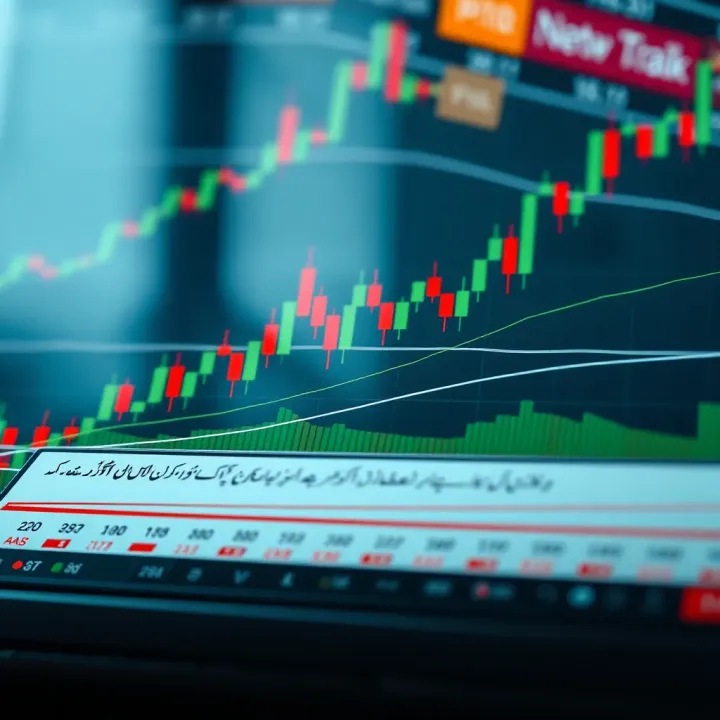
Both the Hammer and Hanging Man look similar with small bodies and long lower shadows. The Hammer appears after a downtrend and suggests buyers are stepping in, signalling a bullish reversal. Conversely, the Hanging Man forms after an uptrend and warns about possible bearish reversal. For instance, on high-volume days, a Hammer can indicate strong support at a certain price level, helping traders plan entry points in volatile Pakistani market sessions.
A Shooting Star has a small body near the candle’s low with a long upper shadow. It usually forms after an uptrend and signals a potential bearish reversal as sellers push prices down from the highs. Traders observing this on daily charts of blue-chip companies listed on PSX might prepare for short-term pullbacks. The pattern gains more weight when followed by bearish volume, confirming sellers gaining control.
The Bullish Engulfing pattern consists of a small bearish candle followed by a larger bullish candle that completely covers the previous one’s body. This suggests a strong shift in momentum from sellers to buyers. For example, in the textile sector, such a pattern after a price dip may indicate buyers’ confidence is returning. It’s useful for timing entry into a rising market.
The Bearish Engulfing shows a small bullish candle followed by a large bearish candle covering it fully. It signals a shift from buying to selling pressure, often marking the start of a downtrend. For traders in PSX, this pattern appearing after prolonged rallies can be a sign to secure profits or tighten stop-loss orders.
These are three-candle patterns signalling reversals. The Morning Star appears after a downtrend, starting with a bearish candle, followed by a small indecisive candle (like a Doji), then a strong bullish candle. It suggests buyers are gaining control. The Evening Star is the opposite, indicating a bearish reversal after an uptrend. These patterns are reliable in Pakistani markets to spot trend changes, especially around major economic announcements.
The Piercing Line pattern happens when a bullish candle closes more than halfway into the previous bearish candle’s body, showing buyers pushing back strongly. Conversely, the Dark Cloud Cover occurs when a bearish candle closes deep into the previous bullish candle, indicating sellers taking charge. Both patterns act as cautionary signals for traders seeking to enter or exit positions on PSX or foreign exchange markets.
Recognising these candlestick patterns with reliable confirmation helps traders navigate Pakistan's often volatile markets more confidently, improving decision-making and managing risk effectively.
Candlestick patterns offer a straightforward visual way to understand market sentiment. Knowing how to read these patterns accurately in Urdu not only makes the learning easier but also helps Pakistani traders connect complex ideas with familiar terms. This section guides you on spotting patterns correctly and applying them for real trading decisions in Pakistan’s markets.
Look for clear formations like long bodies and shadows (wicks) that indicate price action strength or weakness. For example, a Hammer with a long lower shadow suggests buying pressure after a sell-off. Similarly, a Doji signals indecision, where the open and close prices are nearly the same. These shapes tell you whether buyers or sellers are dominating during that trading period.
Many traders jump to conclusions seeing a single candlestick without confirming the context. For instance, mistaking a small-bodied candle with long shadows as a reversal signal when it’s just market noise. Also, ignoring the overall trend and volume can lead to false signals. Always check if the pattern appears after a clear move up or down, as patterns are more meaningful in such contexts.
Volume confirms the strength of the signal. A bullish engulfing pattern paired with higher volume on the Pakistan Stock Exchange (PSX) suggests strong buying interest. Conversely, without decent volume, the pattern might fail. Also, consider local news or economic events impacting market sentiment. For example, during Ramazan or election seasons, price action can be volatile and patterns may not behave typically.
Candlestick signals guide when to enter or exit trades. For example, after spotting a Morning Star pattern indicating a possible rally, you might buy at the next candle’s open. Set stop-loss slightly below the pattern’s low to limit risks. Similarly, spotting a Shooting Star in an uptrend can be a sign to exit or sell to protect profits.
Trading isn’t just about identifying patterns, but also managing risk. A wrong signal can lead to losses, so use stop-loss orders around key candlestick levels. For Pakistani traders facing margin constraints, this method keeps losses manageable, especially on volatile days like budget announcements or political developments.
Candlestick patterns work best when combined with indicators like RSI, moving averages, or support and resistance levels. For instance, a Bullish Engulfing near a strong support zone on PSX adds weight to the buy signal. Likewise, if an Oversold RSI aligns with a Hammer pattern, chances of a bounce increase. This multi-tool approach increases confidence in trading decisions.
Accurate reading and smart application of candlestick patterns in Urdu empowers traders in Pakistan to make better-informed moves while managing risk effectively. It’s about blending visual cues with market context and strategy.
Accessing reliable PDF resources in Urdu makes learning candlestick patterns easier, especially for Pakistani traders who prefer their native language. These resources help bridge the gap between complex financial concepts and practical trading knowledge. PDFs also let you study at your own pace, revisiting difficult points without pressure.
Recommended Urdu trading education websites often provide well-organised PDFs on candlestick techniques and market analysis. Platforms dedicated to financial education in Urdu, such as local trading academies or educational portals catering to Pakistani audiences, make these materials accessible. For example, websites like Investopedia’s Urdu editions or specialised Pakistani trading blogs frequently offer downloadable content tailored to regional market conditions.
FBR and SECP educational material play an important role too. The Federal Board of Revenue (FBR) and the Securities and Exchange Commission of Pakistan (SECP) publish official guides and brochures in Urdu that explain trading rules and market behaviour, including candlestick basics. These documents add authority and keep traders updated on regulatory requirements, ensuring compliance while applying technical analysis.
Community forums and groups for Urdu learning offer a more interactive approach. Pakistani trader groups on social media or dedicated forums share PDFs and discuss their interpretations. This community engagement often clears doubts and provides real-world examples from the Pakistan Stock Exchange (PSX), making learning more relevant to local market conditions.
Language accessibility for Pakistani traders is a key advantage. Many traders find grasping financial jargon easier when explained in Urdu, where technical terms are broken down into familiar words. This reduces misunderstandings and builds confidence in applying candlestick patterns effectively in live trading.
Clear explanations with local examples add significant value. Urdu PDFs often include case studies from Pakistan’s markets, such as uranium share price moves or telecom stocks on PSX, which help learners connect theory with practice. Seeing how candlestick patterns behave during Pakistan’s economic shifts or festival seasons sharpens understanding.
Printable and revisable formats make PDFs convenient for continuous reference. Traders can print these documents for quick review during trading hours or e-study offline when internet isn’t available due to loadshedding. The ability to highlight and annotate pages enhances long-term learning and makes the content a handy trading companion.
Learning through Urdu PDFs offers Pakistani traders clarity and confidence, combining language comfort with practical market insights to help improve trading decisions.
By exploring these resources regularly, you can build a strong foundation in candlestick analysis that suits Pakistan’s unique market environment.
Adapting candlestick patterns to Pakistan’s unique market conditions helps traders make more accurate decisions. These tips bridge theoretical knowledge and real-world application, ensuring patterns fit local market rhythms.
The Pakistan Stock Exchange operates under distinct trends influenced by local economic factors, political updates, and investor sentiment. For example, the PSX often shows sharp movements around budget announcements or interest rate changes by the State Bank of Pakistan. Understanding these local trend catalysts helps traders interpret candlestick patterns better. A bullish engulfing pattern during a phase of political stability may signal more sustainable gains compared to the same pattern during uncertain times.
Moreover, PSX's market liquidity tends to fluctuate, especially in mid-cap stocks. This means candlestick signals must be checked alongside volume data and broader market trends to avoid false signals. Practically, if a hammer candle forms on a low-volume day in a less liquid stock, cautious interpretation is advised.
Economic news like inflation reports, rupee exchange rate shifts, or announcements from the Federal Board of Revenue (FBR) can significantly affect market sentiment. Traders should watch how candlestick patterns behave near such events. For instance, a doji candle before a key announcement may indicate market indecision, warning traders to hold off entering positions until clarity emerges.
Sometimes, negative news causes sudden bearish patterns, but these might reverse quickly once markets absorb the data. Recognising these dynamics helps traders avoid panic selling or rushing into positions immediately after volatile news.
In Pakistan, festivals like Eid or public holidays often lead to thinner trading volumes and erratic price movements. Candlestick patterns during these times can be misleading. For example, a shooting star pattern formed on low volume before Eid might not indicate a strong reversal. Traders should factor in these seasonal patterns and prefer waiting for confirmation when markets normalise.
Additionally, foreign portfolio investments tend to pause during these periods, affecting liquidity. Market volatility also spikes around geopolitical events or elections, making candlestick signals less reliable unless combined with other indicators.
Webinars conducted in Urdu provide practical insights specifically tailored to Pakistani markets. These sessions often feature live chart analysis showing candlestick use in real-time PSX conditions. Such interactions allow traders to clear doubts immediately and discuss local market peculiarities in a language they are comfortable with. Regularly attending these webinars sharpens pattern recognition skills adapted to Pakistan’s trading environment.
Local analysts understand regional economic nuances and can explain candlestick patterns within Pakistan’s market context. Following them on platforms like TV channels, YouTube, or financial news websites helps traders stay updated on market-moving developments and learn how professionals apply technical analysis daily.
Moreover, many analysts discuss the PSX's reaction to global events like oil price changes or US Fed decisions, which impact Pakistani markets. Learning from their commentary enriches a trader's perspective beyond textbook patterns.
Several trading apps now offer Urdu language options or resources to make technical analysis accessible. Apps like PSX Invest or brokers’ platforms with Urdu interfaces help traders track candlestick patterns comfortably. Features such as Urdu charts explanations, notifications on pattern formations, and integrated news feeds provide a comprehensive toolkit.
Using these tools reduces chances of missing important signals due to language barriers or unfamiliarity, making trading more inclusive and effective for local traders.
Remember, no candlestick pattern works in isolation. Integrating local market context, continuous learning, and reliable Urdu resources sharpens your trading edge in Pakistan’s stock market.
Learn the meaning of binary in Urdu 🖥️. Understand how it applies in computing, math, daily life, and related terms for Urdu speakers interested in tech and language.

📈 Master 35 essential candlestick patterns to boost your trading. Learn how to read charts, spot trends, and make smarter market decisions today!

Master key candlestick patterns 📈 Learn to interpret market moves and boost your trading skills. Download your free PDF with 35 essential patterns now! 📊

📉 Learn to spot key bearish chart patterns that indicate falling trends. Get practical tips to manage risk & time your trades better in Pakistani markets.
Based on 6 reviews