
Understanding Candlestick Patterns in Urdu
📈 Understand key candlestick patterns in Urdu to boost your trading skills. Learn basic and advanced formations with practical tips for Pakistan's stock markets.
Edited By
Jack Thompson
Single candlestick patterns are a straightforward yet powerful tool for traders in Pakistan’s equity, forex, and commodity markets. These patterns reveal market sentiment through the formation of just one candlestick on price charts, offering quick clues about possible price movements. Unlike complex multi-candlestick formations, single candlestick patterns require less time to spot but still carry significant insights.
Understanding these patterns helps traders make better decisions by identifying buying or selling pressure at a glance. For example, a hammer suggests a potential price reversal after a downtrend, signalling buyers stepping in, while a shooting star often indicates a coming bearish turn after an upward move.
These are some common single candlestick patterns you will encounter:
Doji: Represents indecision in the market, where open and close prices are almost the same. It signals that buyers and sellers are in balance, so momentum could shift soon.
Hammer: Has a small body near the top, with a long lower shadow. It occurs after a drop and points to strong buying interest.
Shooting Star: The opposite of a hammer, appearing after a price rise with a small body near the lower end and a long upper shadow, warning of a bearish reversal.
Spinning Top: Features small bodies with shadows on both sides, indicating uncertainty and a potential pause in the current trend.
Recognising these patterns takes practice, but once you get familiar, they become quick signals for entry or exit points in your trading strategy.
In Pakistan’s markets, where volatility can spike around political events or economic reports like SBP policy announcements, single candlestick patterns help you react fast. They require no deep technical indicators, making them accessible for beginners yet valuable for seasoned traders.
By combining single candlestick pattern recognition with volume analysis and support/resistance levels, you can improve the timing of your trades and reduce risk. As you follow the charts, keep an eye out for these formations—they offer a visual story of market psychology in a single glance.
Single candlestick patterns are vital for traders who want to make quick decisions based on market behaviour. These patterns use just one candlestick to signal potential price direction, offering immediate clues on sentiment shifts without waiting for longer formations. For example, spotting a hammer candlestick on a daily PSX trading chart might warn that the downtrend could soon reverse, helping traders act swiftly.
Each candlestick captures price movement within a specific period—be it minutes, hours, or days. The basic components include the body, wicks (shadows), open price, close price, high, and low. The body shows the difference between opening and closing prices; a filled body usually means a price drop, while a hollow one points to a rise. The wicks indicate the range outside the open and close, revealing volatility during the session.
Understanding these components helps traders read the story behind price action quickly. For example, a long upper wick with a short body might show sellers pushing the price down after an attempt to push it up.
Single candlesticks represent market psychology by reflecting how buyers and sellers fought over a set period. When the candlestick is bullish (closing higher than opening), it implies buyers outnumbered sellers. Conversely, a bearish candle signals seller dominance. The size of the body and shadows also reveals strength or hesitation. A doji, where open and close are nearly the same, shows indecision—the market is unsure whether to move up or down.
This psychological insight is crucial in fast-moving markets like forex pairs involving PKR, where traders rely on rapid interpretation.
Single candlestick patterns give fast clues about market direction, which is beneficial in intraday and short-term trading. Instead of waiting for multi-candle confirmation, traders can spot patterns like shooting stars or hammers and prepare for potential reversals or trend pauses. This quick reaction capability is valuable in volatile markets like PSX or the forex market where prices shift rapidly.
Besides speed, these patterns are easy to spot and apply, making them accessible to traders with varying experience. Even new traders following SBP policy announcements can use single candlestick signals to anticipate market reactions.
In Pakistani markets, single candlestick patterns hold practical relevance. Equity traders watching the Pakistan Stock Exchange (PSX) see daily candles reflecting political and economic influences, such as changes in government policy or international trade news. Forex traders dealing with USD/PKR or EUR/PKR pairs use these signals alongside economic events to time entries and exits.
Thus, single candlestick patterns act as a bridge between technical analysis and real-world market psychology, offering a timely tool that suits Pakistan’s dynamic financial environment.
Quick interpretation of single candlestick patterns can substantially improve your trading decisions, especially when combined with other indicators and local market knowledge.
Single candlestick patterns play a straightforward yet vital role in reading market movements. They present immediate clues about price directions based on just one candlestick’s shape and position. Understanding these patterns helps traders, especially those active in Pakistan's equity and forex markets, to spot momentum shifts or possible reversals quickly without waiting for several candlesticks to form.
Grasping these patterns’s meaning and context aids in making more timely entries and exits. However, relying solely on these signals may lead to errors, especially when market conditions are volatile or unclear. Let's explore some common single candlestick patterns and their real market implications.
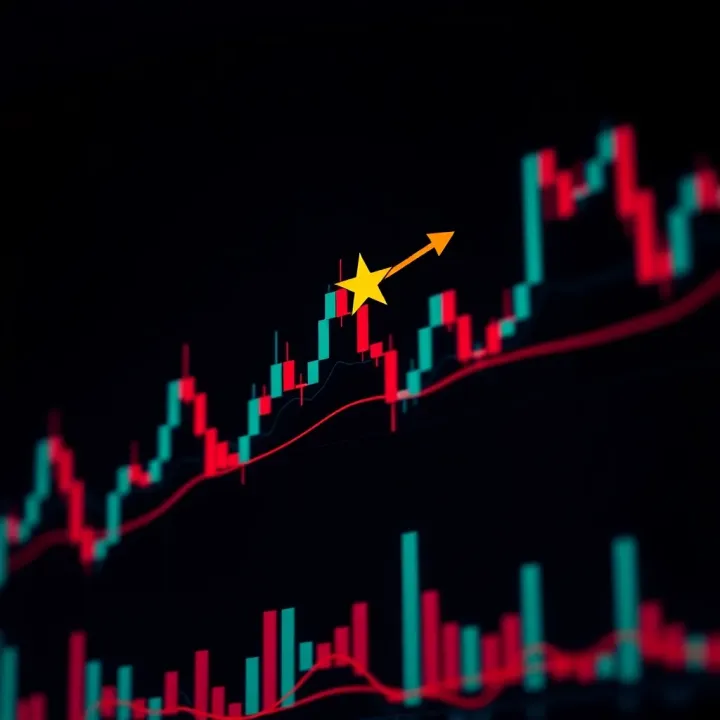
The Doji represents a candlestick where the open and close prices are almost equal, showing indecision between buyers and sellers. There are several types of Doji:
Standard Doji: The open and close are nearly the same, forming a cross-like shape.
Dragonfly Doji: The open and close are at the high of the day, leaving a long lower shadow.
Gravestone Doji: Here, the open and close are at the low of the day, with a long upper shadow.
These variants help traders identify different nuances of indecision or possible turning points. For instance, a Dragonfly Doji after a downtrend may hint at bullish reversal, while the Gravestone Doji following an uptrend suggests bearish pressure.
In markets like the Pakistan Stock Exchange (PSX) or forex pairs such as USD/PKR, Doji patterns often appear before a price correction or a trend pause. They signal moments when buyers and sellers lose conviction in the current direction, which can precede a reversal or consolidation.
Doji acts as a warning: the previous trend might weaken, but confirmation from following candles or volume is key before making trading decisions.
Visually, the Hammer and Hanging Man look alike: a small body at the top of the candle and a long lower shadow extending below. Identifying them depends on the preceding trend:
Hammer appears after a downtrend and indicates potential bullish reversal.
Hanging Man arises after an uptrend, signalling possible bearish reversal.
In practise, if you spot a Hammer on a chart of the PSX blue-chip like HBL after a price decline, it suggests buyers began to step in. Conversely, a Hanging Man at the end of an uptrend might warn to watch for selling pressure.
The key is these patterns show rejection of lower prices. However, traders must verify with volume or following candles for confirmation. For example, a Hammer with high trading volume boosts the chance of a real turn upwards.
The Shooting Star is a single candlestick with a small real body near the day's low, long upper shadow, and little or no lower shadow. This shows the bulls tried to push price up but lost control by close, signaling weakness after an uptrend.
An Inverted Hammer appears after a downtrend with a small body at the bottom and long upper shadow. It hints at a potential shift but demands confirmation.
Both patterns suggest the existing trend is tiring. For instance, a Shooting Star appearing on Pakistan’s currency chart USD/PKR after a rally could indicate sellers are stepping in, possibly leading to a pause or reversal.
A Marubozu has no or very tiny shadows, with the open and close at the extremes of the trading session. A Bullish Marubozu opens at low and closes at high, showing strong buying dominance.
A Bearish Marubozu opens high and closes low, highlighting solid selling pressure.
These candles reveal momentum clearly. For example, a Bullish Marubozu in the PSX's KSE-100 index during a positive economic announcement signals strong confidence, encouraging traders to follow the trend.
The Marubozu’s clear, decisive formation makes it a strong momentum indicator, but as always, combining it with volume or other indicators strengthens the trade signals.
Understanding these single candlestick patterns equips traders with quick insights into market psychology. While useful for spotting potential moves, always consider the bigger chart context and supporting data before acting.
Single candlestick patterns provide quick, visual clues about market sentiment, but using them effectively requires some practical know-how. Blindly trusting these patterns can lead to costly mistakes if traders don’t consider additional signals and the broader market context. This section offers useful tips to improve the accuracy of trading decisions based on these patterns.
Volume plays a key role in validating single candlestick patterns. For instance, if a bullish Hammer forms with a significant increase in traded volume, it suggests strong buying interest supporting a possible reversal. Without volume confirmation, the pattern might lack conviction and be more prone to failure. In the Pakistan Stock Exchange (PSX), this approach helps filter fakeouts, especially during low liquidity periods or political volatility.
Alongside volume, indicators like the Relative Strength Index (RSI) and moving averages improve assessment. When a Doji appears near key moving averages—like the 50-day or 200-day—it gains more significance. If the RSI also shows oversold or overbought conditions, it reinforces the likelihood of a trend change. For example, an Inverted Hammer with RSI below 30 could signal a genuine bullish bounce rather than a short-term pause.
Context is everything in trading, and understanding where a candlestick forms matters greatly. Patterns at strong support or resistance zones carry more weight. A Shooting Star appearing at a resistance line suggests a genuine potential top, but the same pattern mid-trend might not mean much. Ignoring chart context can lead to misreading signals, causing losses especially in volatile markets like forex pairs involving PKR.
Traders should not rely solely on single candlestick signals for entries or exits. These patterns are best used as part of a toolkit, combined with trend analysis, volume, and other technical or fundamental factors. For instance, a Hammer alone doesn't guarantee a rally; monitoring news events, SBP policy changes, or geopolitical developments provides additional layers of safety. Relying only on candlestick shape risks traps in choppy markets common during monsoon season or election cycles.
Successful trading blends candlestick insights with broader analysis. Patterns point the way but never tell the whole story.
By confirming patterns through traded volume and supporting indicators, and by respecting market context, traders can make more informed decisions in the Pakistani equity and forex markets. Avoiding common pitfalls and integrating multiple tools improves the chances of spotting genuine trend reversals and momentum shifts.
Trading in Pakistan’s financial markets requires awareness of local dynamics alongside technical tools like single candlestick patterns. These patterns can offer valuable signals for timing entries and exits, especially when adapted to the specific behaviour of markets such as the Pakistan Stock Exchange (PSX) and the forex market for PKR pairs. Understanding how these patterns interact with local market conditions helps traders make more informed decisions and manage risk better.
The Pakistan Stock Exchange experiences notable volatility influenced by domestic corporate earnings, government policies, and external pressures like global commodity prices. Using single candlestick patterns here can help identify potential short-term reversals or continuations amidst such fluctuations. For example, spotting a hammer candlestick after a downtrend on a blue-chip stock like Oil and Gas Development Company Limited (OGDCL) might hint at a bounce back in price, signalling a buying opportunity.
In practical terms, combining candlestick insights with volume analysis can give stronger signals on PSX stocks. When a bullish marubozu forms with high volumes in stocks like Lucky Cement or Habib Bank, it often indicates solid buying interest — especially important before earnings announcements or economic reports.
For forex traders focusing on PKR pairs, single candlestick patterns assist in identifying moments of indecision or momentum shifts. The USD/PKR and EUR/PKR pairs react sharply to both global trends and local events. A gravestone doji appearing after an uptrend in USD/PKR, for instance, may warn traders of a near-term correction or resistance, guiding profitable exit or hedge decisions. Candlestick signals thus complement fundamental analysis effectively in Pakistan’s forex arena.
The monetary policy decisions by the State Bank of Pakistan (SBP) carry strong influence on price action in equity and forex markets. Rate hikes or cuts tend to provoke sharp reactions captured by candlestick patterns. For example, a bearish shooting star on PSX in response to a surprise SBP interest rate increase can suggest bearish sentiment dominating the market promptly. Traders who watch these signals alongside SBP policy statements can anticipate trend shifts more confidently.
Political developments and government announcements also create volatility that single candlestick patterns reflect quickly. Election results, budget speeches, or regulatory changes might trigger sharp price movements visible through pattern changes like doji or hammer candles. In April 2023, several PSX stocks showed hammer patterns during political uncertainties, indicating potential support as traders reassessed risks. Integrating candlestick reading with news flow allows market participants to better gauge sentiment and plan trades accordingly.
Successful use of single candlestick patterns in Pakistan's markets depends on combining technical signs with local economic context and events. This approach helps in spotting genuine trading opportunities and avoiding false signals.
By tailoring candlestick analysis to Pakistan’s unique market environment, traders and investors enhance their ability to navigate volatility and improve decision-making across equity and forex trading. This localised understanding bridges global technical tools with practical, real-market applications.
Trading based on single candlestick patterns can offer quick insights, but using them wisely is essential for successful market decisions. These patterns by themselves do not guarantee outcomes; instead, they work best when combined with other market information like volume, trend analysis, and support or resistance levels. For instance, spotting a hammer candlestick near a known support zone on the Pakistan Stock Exchange (PSX) could signal a potential bullish reversal, but without confirmation from increased volume or a positive RSI divergence, the signal may be weak.
Understanding the broader market context and timing is just as important. Local economic events—such as an unexpected monetary policy announcement by the State Bank of Pakistan (SBP) or political developments—can override pattern signals and lead to sudden price moves against expectations. Therefore, traders should always consider external factors alongside candlestick patterns to reduce risks.
"No single candlestick pattern is foolproof; the key lies in combining them with proper analysis and risk management."
Single candlestick patterns act as quick signals that reflect market psychology and potential price action, but they require context for reliable use.
Patterns like Doji, Hammer, and Marubozu help identify market indecision, reversals, or momentum shifts; each pattern has nuances based on its formation and location within the chart.
Confirmation with indicators and volume is essential. Signals backed by rising volume or positive support from indicators like RSI or moving averages tend to be more credible.
Avoid trading on a single candlestick alone. Always check larger trends, nearby support/resistance, and recent news, especially relevant economic announcements within Pakistan.
Adapt patterns to the Pakistani market environment. Certain behaviour in PSX shares or PKR forex pairs might differ from international markets due to local liquidity and event sensitivity.
Focus on practice and observation. Backtest different single candlestick patterns using historical data from PSX or forex PKR pairs to see how they performed during various market conditions. Use demo accounts on local trading platforms before real investment.
Risk management cannot be overstated — always set stop losses according to your strategy rather than hoping a pattern will work out. Don't rely on patterns alone to buy or sell; use them as part of a disciplined trading plan.
Continuous learning helps. Stay updated on Pakistan’s economic trends, SBP announcements, and political developments, since these impact market psychology and can affect candlestick reliability.
Trading single candlestick patterns is a handy skill when used carefully and combined with solid analysis and proper discipline. Over time, it can sharpen your market timing and improve decision-making in equity, forex, and commodities within Pakistan’s unique trading landscape.
📈 Understand key candlestick patterns in Urdu to boost your trading skills. Learn basic and advanced formations with practical tips for Pakistan's stock markets.
📈 Master 35 essential candlestick patterns to boost your trading. Learn how to read charts, spot trends, and make smarter market decisions today!
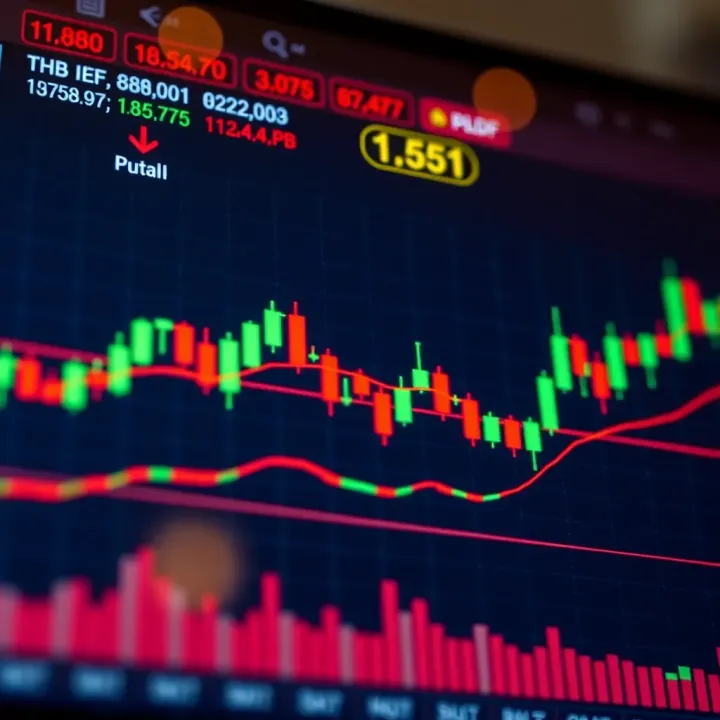
Master key candlestick patterns 📈 Learn to interpret market moves and boost your trading skills. Download your free PDF with 35 essential patterns now! 📊
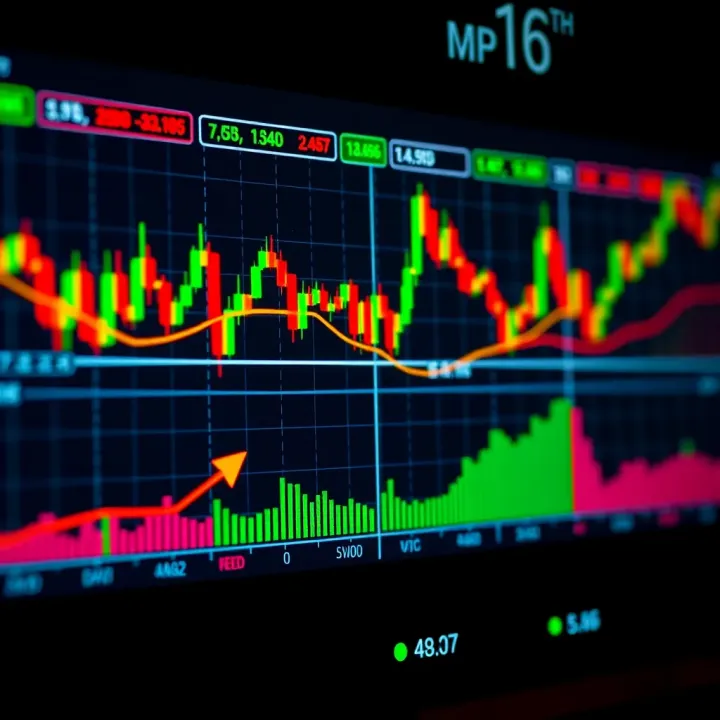
Explore key chart patterns in cryptocurrency trading 📉📈 to spot market trends accurately. Learn how to apply these patterns for better decisions in Pakistan's crypto market.
Based on 14 reviews