
Complete Guide to Candlestick Patterns in Trading
📈 Master candlestick patterns from single to complex forms to better read market psychology and predict price moves in Pakistani and global markets.
Edited By
Liam Edwards
Candlestick patterns are like the secret language of the markets. If you’re serious about trading or investing, understanding these patterns can give you a leg up. Instead of guessing what the price might do next, you read the signals the market’s giving out.
This guide breaks down some of the most powerful candlestick formations you’re likely to see. You’ll learn what they mean, why they matter, and how to spot them without getting overwhelmed. Plus, there's a handy PDF packed with 35 essential patterns you can download and keep with you for quick reference.
Navigating stock charts can feel like trying to read tea leaves, but candlesticks offer a clearer, more direct story. From spotting trend reversals to confirming the strength of a move, these patterns help traders make smarter, more confident decisions.
Whether you’re an experienced trader or someone just starting to dip a toe in the waters, this practical guide is designed to give you actionable insights you can apply right away. So, let’s cut through the noise and get straight to the heart of reading price action like a pro.
Candlestick patterns are more than just pretty lines on a chart—they’re a practical tool to read the market’s mood. For traders and investors, understanding these patterns can offer a clearer picture of potential price moves before they actually happen. Whether you’re dabbling in stocks, forex, or commodities, knowing the basics helps you spot opportunities and manage risks better.
Most folks jump straight into complicated indicators without grasping the candlestick basics, which can lead to some costly mistakes. This section lays down the foundation, so you’re not just guessing but making informed decisions based on how traders have historically behaved.
Each candlestick tells a mini-story of price action for a given timeframe—be it a minute, an hour, or a day. The body represents the open and close prices, while the wicks (or shadows) show the high and low points. For example, a long green (or white) body means buyers dominated and pushed the price higher during that period.
For traders, this breakdown is gold because it captures the sentiment at a glance. If a candlestick has a tiny body but long wicks, it signals indecision—buyers and sellers are pushing price in both directions but neither is dominating.
By focusing on these components, you start to notice when momentum shifts, which can help time entries or exits more effectively.
Both candlestick and bar charts show the same basic price information—open, high, low, and close—but candlesticks do it visually stronger. Candlesticks use colored bodies to indicate bullish or bearish moves, which makes patterns easier to spot. Bar charts, on the other hand, rely on lines, which might look cleaner but don’t convey as much quick info about market sentiment.
For instance, a big bullish engulfing pattern jumps out on a candlestick chart but might not be as obvious on a bar chart. This visual edge is why candlestick charts have become a staple for traders worldwide.
Candlestick patterns work like warning signs, often showing when a trend might pause, reverse, or accelerate. They’re based on collective trader psychology—fear, greed, hesitation—which tends to repeat itself.
Take the hammer pattern: typically forming at a downtrend’s bottom, it signals a possible turn-up because buyers stepped in hard after a sell-off. Spotting this could mean avoiding a potentially bad short position or jumping in early on a reversal.
While no pattern guarantees success, understanding these signals helps traders stack the odds in their favor. It’s about reading crowd behavior, which plays out repeatedly in the markets.
Traders use candlestick patterns in various ways. Day traders might look for quick reversals using single-candle signals like dojis or spinning tops. Swing traders pay attention to multi-candle formations such as engulfing patterns or morning stars as confirmation before holding positions days or weeks.
These patterns can also work with other tools—combining a bullish engulfing pattern near a strong support level with high trading volume gives a much stronger buy signal than the pattern alone.
Ignoring candlestick patterns is like trying to navigate without a compass—they provide simpler, immediate clues amid market noise.
Remember, mastering basic candlestick patterns is the first step toward reading charts like a pro. It’s not just memorizing shapes, but understanding what each one reflects about trader sentiment and potential price action.
Understanding key candlestick patterns is a foundational skill for anyone serious about trading or investing. These patterns offer quick snapshots of market sentiment, hinting at possible trend reversals or continuations. By recognizing these formations, traders can make more informed decisions, helping to reduce guesswork.
Knowing these patterns doesn’t guarantee success, but it provides a clearer map through market noise. Imagine trading without knowing what a hammer or doji looks like—it would be like trying to read a book with half the pages missing.
The Hammer and Hanging Man are two sides of the same coin, often signaling a potential shift in market direction. Picture a hammer-shaped candle with a small body and a long lower wick. When it shows up at the bottom of a downtrend, it's called a Hammer and can indicate buyers are stepping in. Conversely, the Hanging Man appears after an uptrend and warns of possible selling pressure ahead.
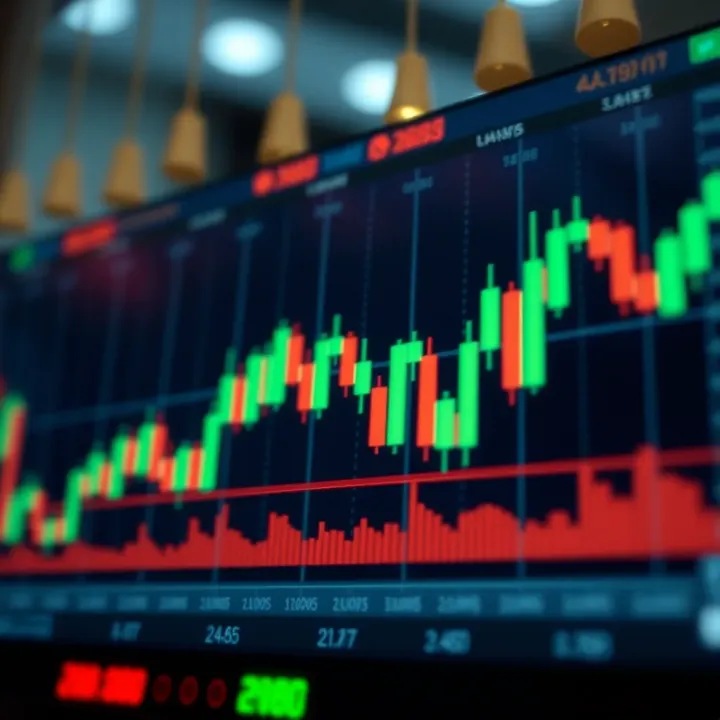
For example, if you see a Hammer pinbar on a daily chart of the Pakistan Stock Exchange after a dip, it could suggest a buying opportunity. But context matters—look for confirmation from the next candle or other indicators before jumping in.
Doji candles, where open and close prices are nearly the same, tell a story of indecision. Variants like the Long-legged Doji, Dragonfly Doji, and Gravestone Doji reflect subtle differences in market battle between bulls and bears.
A Dragonfly Doji at the bottom of a decline means bulls tried to push prices up but lost momentum, hinting at a possible reversal. On the flip side, a Gravestone Doji near resistance could warn that bulls are losing steam.
These patterns serve as caution signals—you wouldn’t rush in blindly when the market’s clearly uncertain.
Spinning Tops are candles with small bodies and long wicks on both sides, showing a balance between buyers and sellers. They often appear during consolidation phases, suggesting traders are weighing options before making their move.
For instance, a Spinning Top after a strong uptrend might indicate hesitation, signaling that the momentum is weakening. Traders can use this to prepare for possible reversals or sideways trends.
Engulfing patterns consist of two candles where the second "engulfs" the first entirely. A Bullish Engulfing happens during a downtrend when a strong green candle covers the entire previous red candle, suggesting buyers are taking control.
Conversely, a Bearish Engulfing is the red candle swallowing the green one in an uptrend, hinting at a sell-off.
For example, if on a daily chart of a popular Pakistani blue-chip stock, a Bullish Engulfing forms after several bearish days, it might imply the start of an uptrend. Still, combining this with other tools like volume can improve accuracy.
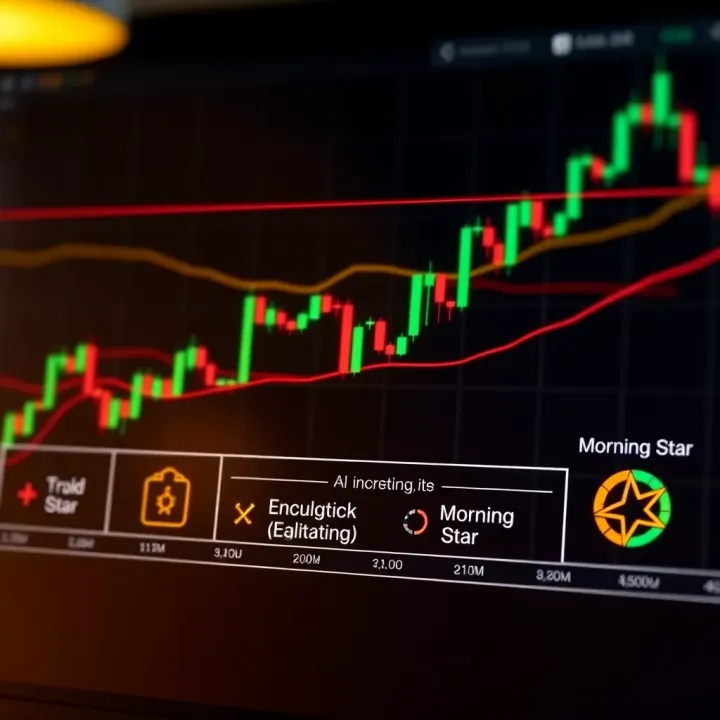
These three-candle patterns reflect significant turning points. The Morning Star appears at the bottom of a downtrend and signals an upcoming rise, while the Evening Star shows up at the top of an uptrend, warning of potential fall.
The middle candle in these patterns is usually a Doji or Spinning Top, reflecting market indecision before the turnaround. Traders watch for these signals to time entry or exit points effectively.
When three strong bullish candles form consecutively, it’s called Three White Soldiers and suggests sustained buying pressure. On the flipside, Three Black Crows are three red candles in a row, pointing toward continued selling.
A practical case: spotting Three White Soldiers in the aftermath of a correction in the Karachi Stock Exchange might encourage traders to consider long positions. Yet, these patterns should not be used in isolation—context and confirmation still matter.
Knowing these key candlestick patterns helps traders spot opportunities and risks early, making your trading decisions less about luck and more about informed strategy.
Using candlestick patterns effectively is about more than just spotting familiar shapes on charts. To truly benefit from these patterns, traders need to understand the bigger picture and combine these insights with other analysis tools. This approach helps filter out noise and avoid false signals, giving stronger confidence in trading decisions. For example, a bullish engulfing pattern on its own might look promising, but if it happens near a strong resistance level without volume support, the chance for a reversal might be low.
Support and resistance levels are the backbone of technical analysis and work hand-in-hand with candlestick patterns. These levels act as psychological price barriers where supply and demand shift. When a bullish candlestick forms right on a solid support line, it often signals a higher probability that prices will bounce back up. Conversely, a bearish pattern near resistance can indicate a potential reversal. Understanding these levels helps traders avoid jumping into trades based solely on candlestick appearances.
Volume confirmation adds an important layer of credibility to candlestick patterns. If a bullish hammer appears after a downtrend but volume is thin, it might be a weak signal. But if accompanied by a spike in trading volume, it shows strong buying pressure reinforcing the pattern's message. On the other hand, low volume during a supposed breakout candle might suggest traders are just testing the waters without serious commitment.
Traders also benefit from using trend lines and moving averages alongside candlestick patterns. These tools help define the trend’s direction and strength. For instance, spotting a reversal candlestick pattern right at the 50-day moving average or a well-drawn trend line can provide a double confirmation for entering or exiting a trade. Ignoring these lines might lead to misreads, as the pattern alone doesn’t tell the whole story.
One common pitfall is misreading pattern context. A hammer candlestick in an uptrend is a potential continuation sign, but the same hammer in a prolonged downtrend may signal a reversal. Without considering the current trend, traders may assume patterns always mean the same thing. It's crucial to view each pattern within its environment, such as the recent price action and other technical indicators.
Another big mistake is ignoring overall market trends. Candlestick patterns don’t work in isolation. If the market is clearly trending downwards, a few bullish candles might only be a pause before prices keep falling. Trying to fight the broader trend often leads to losing positions. Smart traders align their pattern trades with the global market direction for higher probability setups.
Remember, candlestick patterns are just one piece of the puzzle. Their real strength shines when combined with solid support and resistance, volume insights, and trend analysis.
In short, start by identifying the pattern, then check where it forms relative to supports, resistances, and moving averages. Add volume clues to confirm the move, and always keep the bigger market trend in mind. This layered approach turns simple candlestick reading into a practical, usable tool for better trading.
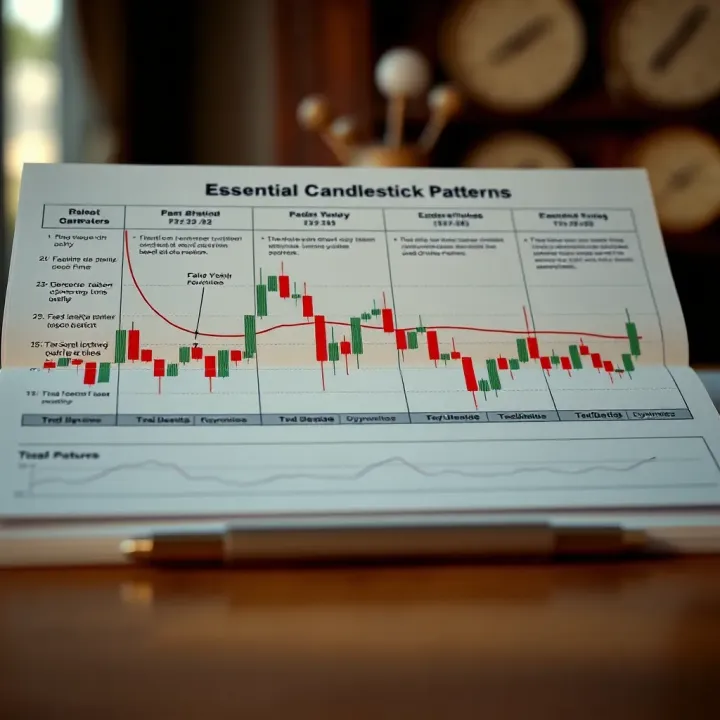
For anyone serious about enhancing trading skills, having a detailed resource at your fingertips can make a real difference. The comprehensive candlestick patterns PDF is designed to be just that—a practical guide packed with essential patterns that traders encounter daily. By accessing this PDF, you break down the complexity of candlestick charts into digestible bits, making it easier to spot meaningful signals without second-guessing.
This is not just another generic cheat sheet. The resource combines clear visuals and straightforward explanations that appeal to both new traders and seasoned investors. Imagine having all 35 powerful candlestick patterns in one place—this makes your reference quick and handy, ensuring you never miss an opportunity due to uncertainty or oversight. Think of it as your trading sidekick, especially useful when you’re sifting through volatile market data.
The PDF covers a wide range of candlestick patterns, including single candle indicators like the Hammer and Doji, as well as multi-candle formations such as the Morning Star and Engulfing patterns. This thorough coverage helps traders recognize subtle shifts in market sentiment early. For example, knowing when a Three White Soldiers pattern forms can suggest continued bullish momentum, guiding your decision to enter or hold a position.
Because these patterns are organized neatly with explanations right beside them, you won’t waste time flipping through bulky manuals or digging through endless online articles. This structured overview helps you build confidence gradually by mastering patterns one at a time until they become second nature.
A picture says a thousand words, especially in trading where timing and clarity are everything. The PDF includes clear, annotated charts for each pattern, showing what a bullish versus bearish version looks like in real market scenarios. This hands-on approach helps you connect theory with what actually happens on your trading platform.
Visual aids help spot patterns faster, reducing guesswork. For instance, if you see a Hanging Man pattern near a resistance level on your charts, the PDF’s examples will help you confirm whether it's a valid warning to sell or a false signal. Learning this way builds practical skills that make your trading decisions more grounded.
Beyond just showing patterns, the PDF offers useful tips to avoid common pitfalls. For example, it cautions against relying solely on candlestick signals without looking at volume or overall market trends. It advises patience, reminding readers that even strong patterns can fail when market conditions change suddenly.
These tips serve as gentle reminders that trading is part art, part science. Knowing when to act and when to hold back is as important as identifying patterns correctly. The PDF encourages using candlestick patterns as part of a broader strategy rather than standalone signals.
Getting hold of the PDF is straightforward. Typically, you fill out a simple form providing your email, and immediately receive a download link. This instant delivery means you can start learning without waiting. Some platforms might also offer a direct button labeled "Download Now," making the process even swifter.
Ensure you save the file in a location that’s easy to remember—maybe a dedicated folder for trading resources—so it’s ready when you need it during fast-moving markets. Also, it's a good idea to keep an updated copy on your mobile device or cloud storage for quick access whenever inspiration strikes.
Treat the PDF as a workbook, not just a one-time read. Start by skimming through all patterns to get a feel for the content, then focus on a handful each week. Combine studying with real market observations: try spotting patterns in your live charts as a way to reinforce learning.
Set small goals, like mastering three new patterns per week, then review your trades to see if you noticed them in time. It’s like learning a new language—you pick it up best by practicing regularly and applying what you’ve learned immediately.
Most importantly, don't rush. Trading patterns work best as part of a steady rhythm, where you gradually build confidence while adapting to different market conditions. Keep notes on which patterns you've seen succeed or fail, and adjust your strategy accordingly.
"The right tools in hand combined with patient study transform raw information into trading wisdom."
Accessing, studying, and applying the comprehensive candlestick patterns PDF is a pragmatic step toward becoming a more confident and savvy trader, helping you read the market’s subtle hints clearly and without fuss.
Bringing candlestick patterns into your trading routine isn’t just about spotting shapes on a chart; it’s about making more informed decisions that can improve your trading outcomes. This final section highlights how combining what you've learned about patterns with real-world practice can boost your confidence and serve as a foundation for continuous improvement. Understanding patterns alone won’t do the trick; it’s the integration and application in your trading strategy that counts.
Backtesting patterns is like taking a test drive for your trading strategies. You look back over historical price data and see how a particular candlestick pattern would have played out. This helps you understand the pattern’s reliability and performance without risking your money. For instance, if a bullish engulfing pattern often led to a noticeable price rise in past data, you might put more weight on it during live trades. Use trading platforms like MetaTrader or TradingView that support backtesting with candlestick recognition features to get hands-on.
On the other hand, simulated trading lets you practice spotting and reacting to candlestick patterns in real-time market conditions without financial risk. Many brokers offer demo accounts where you can execute trades as if you were in the market. This step bridges theory and actual trading, allowing you to experiment with timing, position sizes, and risk management. For example, you might identify a morning star pattern and decide when exactly to enter or exit a position during simulation before applying it in your main account.
Practice is the backbone of confidence. Backtesting teaches you pattern behavior over time, while simulated trading lets you build real-time decision skills safely.
Learning never really stops when it comes to trading. Finding additional resources such as books like "Japanese Candlestick Charting Techniques" by Steve Nison, online courses, or webinars can expand your understanding and expose you to new strategies or nuances of candlestick analysis. Forums like Reddit’s r/Forex or sites like Investopedia can provide practical tips and community support, keeping your knowledge fresh.
Equally important is staying updated with market shifts. Financial markets continuously evolve due to economic changes, geopolitical events, and technological advances. Regularly reviewing market news and adapting your candlestick interpretation ensures you’re not stuck applying outdated patterns blindly. Tools like economic calendars and news feeds from Bloomberg or Reuters help you remain responsive. Also, periodic reviews of your trading results can highlight when adjustments are necessary.
Integrating candlestick knowledge with ongoing practice and learning creates a more resilient trading approach. Over time, this combination helps you become a sharper market reader, improving your odds of success in Pakistan’s dynamic trading environment and beyond.
📈 Master candlestick patterns from single to complex forms to better read market psychology and predict price moves in Pakistani and global markets.

📊 Master key candlestick patterns for trading in Pakistan with our detailed guide. Access reliable PDF resources for deep insights and smart market moves!
📉 Learn how bearish candlestick patterns signal market drops, helping traders in Pakistan spot trends, manage risks, and improve timing in trades.
📈 Master advanced candlestick patterns for smarter trading! Get practical tips, quick recognition tricks, and in-depth insights to improve your market analysis today.
Based on 10 reviews