

Understanding Bearish Chart Patterns for Traders
📉 Learn to spot key bearish chart patterns that indicate falling trends. Get practical tips to manage risk & time your trades better in Pakistani markets.
Edited By
James Thornton
Chart patterns play a major role in cryptocurrency trading by giving traders visual cues about potential market moves. These patterns are formed by connecting price points on candlestick or line charts and help predict whether a cryptocurrency's price might go up, down, or consolidate.
Unlike traditional stock markets, the crypto market runs 24/7, often showing volatile price swings. This volatility makes recognising chart patterns in crypto especially important for timing entries and exits effectively. For example, a successful trader spotting a head and shoulders pattern early can avoid heavy losses by selling before a downtrend starts.
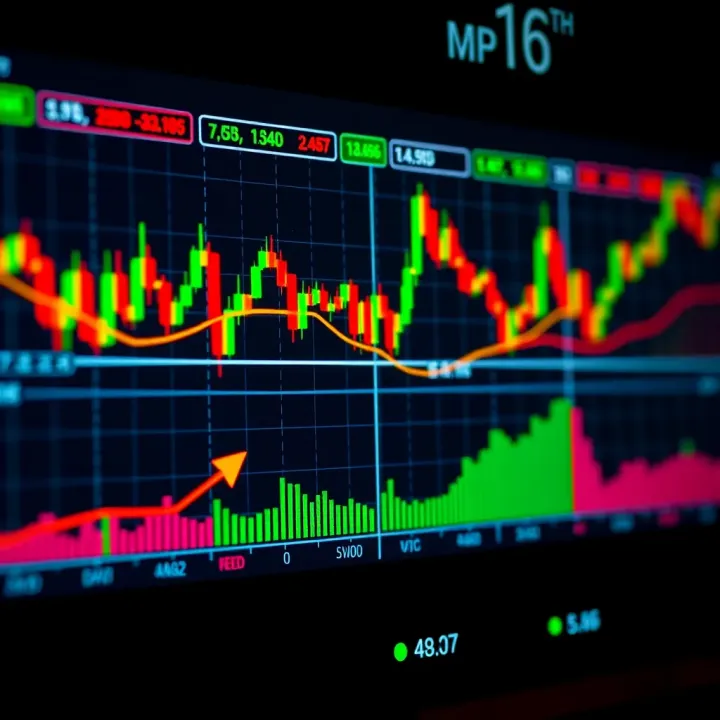
Commonly used patterns fall into two main categories: reversal and continuation. Reversal patterns suggest a trend change, signalling when bullish momentum may switch to bearish, or vice versa. Continuation patterns indicate price pauses with a likely continuation in the same direction.
Here are few typical patterns relevant in cryptocurrency trading:
Head and Shoulders: Indicates trend reversal; bearish after an uptrend, bullish if inverted.
Double Top and Double Bottom: Shows a failed attempt to break a support or resistance level, signalling possible reversal.
Triangles (Ascending, Descending, Symmetrical): Represent consolidation; breakout direction guides next move.
Flags and Pennants: Small pauses after sharp moves, usually resuming the current trend.
Recognising these patterns can improve your ability to forecast price swings and manage your risk better.
For Pakistan-based traders, understanding these patterns alongside local market factors such as regulatory news or exchange volume on local platforms provides an edge. It is also wise to combine pattern analysis with basic indicators like RSI or volume spikes to confirm signals.
In short, mastering chart patterns equips you with a visual toolkit to better read market psychology and react swiftly, which is critical in the fast-moving world of cryptocurrencies.
Chart patterns serve as visual tools that help traders anticipate future price movements based on historical data. In the volatile environment of cryptocurrency markets, recognising these patterns can provide valuable clues for making informed decisions. For example, spotting a "double bottom" pattern might signal a potential reversal from a downtrend to an uptrend, allowing you to enter a trade early.
Chart patterns are specific shapes or formations created by price movements on a trading chart over time. These shapes emerge due to market psychology—how traders collectively react to news, emotions, and technical signals. Their significance lies in offering a systematic way to interpret price directions without relying solely on guesswork.
In practice, chart patterns help simplify the complex price action by grouping movements into familiar forms. For instance, a "head and shoulders" pattern often indicates an upcoming trend reversal, so traders watch for this to time their entries or exits effectively.
Technical analysis relies heavily on chart patterns as visual cues to predict price behaviour. Traders use these patterns alongside indicators and volume data to confirm trends and potential turning points. This approach is particularly useful when fundamental data is scarce or unreliable, as often happens in the fast-changing cryptocurrency space.
For example, if Bitcoin’s price forms a symmetrical triangle, technical analysts might interpret this as a consolidation phase, expecting a breakout either upward or downward. Such insights help manage risk and set realistic profit targets.
Due to cryptocurrency markets’ high volatility, chart patterns can appear suddenly and change rapidly. This means pattern reliability can be less stable than in traditional markets. However, experienced traders learn to spot the strongest signals by combining patterns with volume analysis and broader market context.
For example, a false breakout often occurs in crypto due to sudden pumping by large holders (“whales”). Understanding this risk prevents rash decisions. Hence, pattern recognition alone isn’t enough; reading the broader situation is key.
Compared to equities or forex markets, cryptocurrency trading is relatively young and less regulated. This affects chart patterns because price moves can be more erratic, influenced by factors like regulatory announcements or social media trends. In contrast, traditional markets tend to follow more established technical behaviours.
Still, many classic patterns such as flags, wedges, and head and shoulders remain relevant in crypto. The difference lies in the speed and reliability of confirmations. Traders in Pakistan should therefore adjust their strategies by using tight stop losses and validating patterns with multiple tools before placing trades.
Recognising chart patterns is only part of successful trading in cryptocurrencies; combining them with market awareness and risk management is essential for better outcomes.
Key takeaways:
Chart patterns visually reflect collective trader psychology
They help in predicting possible price moves
Crypto volatility demands careful confirmation of patterns
Local traders must adapt methods from traditional markets thoughtfully
Understanding these basics lays the groundwork for applying specific patterns and trading strategies confidently in Pakistan’s crypto market.

Recognising common chart patterns plays a vital role in cryptocurrency trading since these patterns provide clues about possible market direction changes or continuations. For traders in Pakistan, understanding these patterns helps make timely decisions to enter or exit trades, especially given crypto’s notorious volatility. Let’s explore some key chart patterns and their practical uses.
Head and Shoulders signals a potential trend reversal. This pattern forms when a price rises to a peak (left shoulder), pulls back, makes a higher peak (head), dips again, then makes a lower peak (right shoulder). In crypto, spotting this indicates that the bullish momentum might be losing steam and could shift to a downtrend. For example, if Bitcoin shows a head and shoulders near its recent high, cautious traders often prepare for possible price drops and tighten stops.
Double Top and Double Bottom also predict reversals but look simpler. A double top forms two peaks at roughly the same level, suggesting resistance is strong, and price might fall. Conversely, a double bottom forms two lows, hinting support could hold and price may climb. Pakistani traders watching altcoins like Dogecoin could use these patterns to time exits or entries. For instance, a double bottom after a sharp fall can mark a good buy zone.
Flags and Pennants are short-term patterns that indicate a pause before the previous trend resumes. A flag appears as a small rectangular price channel moving against the trend, while a pennant looks like a tiny symmetrical triangle after a sharp move. These patterns often follow rapid rallies or drops in crypto markets, such as a sudden surge in Ethereum, then a brief consolidation within a flag before continuing upward. They help traders spot low-risk entry points during strong trends.
Triangles (Ascending, Descending, Symmetrical) show consolidation and indecision but usually end with continuation. An ascending triangle has flat resistance with rising lows, signalling bullish pressure. Descending triangles have flat support with falling highs, indicating possible bearish breaks. Symmetrical triangles have converging trendlines, reflecting balanced forces until a breakout. For Pakistani day traders analysing exchanges like Binance, triangle breakouts offer clear signals and potential for quick gains.
Cup and Handle resembles a rounded bottom followed by a smaller consolidation, often hinting bullish continuation once price breaks the handle's resistance. Though slower to form, this pattern is useful for spotting strength in coins like Ripple or Litecoin over weeks.
Wedges look like slanting triangles where price moves up or down but with a narrowing range. Rising wedges often precede bearish reversals, while falling wedges may lead to bullish breakouts. These patterns alert traders to a weakening trend momentum that might soon reverse, an insight valuable in volatile Pakistani crypto markets.
Understanding these patterns allows Pakistani traders to react proactively rather than guesswork. Remember, combining patterns with volume and support levels provides stronger confirmation.
In summary, getting familiar with common reversal and continuation patterns sharpens your trading edge. Use them with a clear plan and risk management to navigate Pakistan’s dynamic crypto scene effectively.
Analysing and trading using chart patterns is key for making smarter entry and exit decisions in cryptocurrency markets. These patterns signal potential price moves, but confirming them before acting helps avoid costly mistakes. Understanding volume trends and support/resistance levels improves your edge by showing if the pattern has backing or could fail.
Volume analysis plays a vital role in validating chart patterns. When a pattern forms, seeing a surge in trading volume adds credibility. For instance, in a breakout from a triangle pattern, much higher volume than usual suggests genuine buying interest. Without this volume spike, the breakout could be a false signal, leading to losses if you enter too early. Traders monitor volume to distinguish solid moves from weak attempts that might quickly reverse.
Similarly, support and resistance levels mark price zones where buying or selling pressure has historically affected price direction. Confirming that a pattern respects these levels strengthens confidence. For example, if a double bottom pattern forms near a known support zone on a Pakistani exchange like Binance or local platforms, it signals buyers are defending that price. Prices bouncing off resistance after a breakout confirm potential upward momentum. Ignoring these critical zones risks mistiming your entries and exits, especially in volatile crypto markets.
Setting stop loss points helps contain losses if the market moves against your trade after the pattern breaks. Typically, stop losses are placed just below the pattern’s support level for long positions, or just above resistance for shorts. For example, after entering a trade on a confirmed breakout of a Cup and Handle, placing a stop loss a little below the handle's low protects against sudden reversals. This approach ensures you don’t lose more than you can afford, which is essential in cryptocurrency trading due to frequent price swings.
Determining potential targets ensures you exit at profitable levels without greed. Each pattern provides a rough estimate of expected price movement. A standard method is measuring the height of the pattern and projecting it from the breakout point. For instance, in an ascending triangle, the difference between support and resistance gives the target range. Knowing these targets helps Pakistani traders plan their trades realistically, avoiding holding positions too long or selling too early. Combining targets with stop losses maintains effective risk-reward management.
Remember, no chart pattern guarantees success. Confirmation with volume and key price levels, plus well-set stop loss and targets, form a practical strategy that works better in real trading.
Using these practical steps can help you trade cryptocurrency with more confidence and reduce surprises in Pakistan’s dynamic crypto market.
Chart patterns give vital clues about market directions, but they have clear drawbacks, especially in cryptocurrency trading. Because crypto markets are highly volatile and less regulated, relying solely on chart patterns can lead to misinterpretations and losses. Recognising these limitations helps traders avoid overconfidence and encourages the use of additional tools.
Whale activity and pump-and-dump schemes often distort chart patterns. Large investors—called whales—can suddenly buy or sell significant amounts of a cryptocurrency, causing abrupt spikes or drops. For example, a whale might push the price up rapidly (pump), attracting smaller traders before dumping their holdings. This artificial movement breaks usual pattern logic and may lead traders to expect a trend reversal or continuation that never truly materialises.
Such manipulations make it risky to trust chart formations without confirming volume behaviour or order book insights. In Pakistan’s crypto community, where liquidity on local exchanges can be thin, even moderate whale activity can trigger false signals. Traders should watch for unusual volume surges that don’t align with broader market news as a red flag.
False breakouts and pattern failures are common in cryptocurrencies because of the market’s erratic swings. A price may appear to break a key resistance level, hinting at a bullish trend, but soon retrace sharply, trapping traders who bought too early. This failure to sustain a breakout is often due to insufficient buying interest or sudden profit-taking.
For example, an ascending triangle pattern might show a breakout, but without confirming volume or follow-through momentum, the move may stall. Pakistani traders should use smaller position sizes until breakout confirmation, ideally waiting for a candle close above the breakout level before committing.
Using indicators like Relative Strength Index (RSI) and Moving Average Convergence Divergence (MACD) can add much-needed confirmation to chart patterns. RSI helps identify overbought or oversold conditions, signalling when a reversal pattern might be more reliable. MACD measures trend momentum changes, assisting traders in catching continuation moves early.
For example, a double bottom pattern combined with a bullish crossover in MACD enhances confidence in an upward move. These indicators reduce false signals by filtering out noise that pure price patterns might miss.
Fundamental news analysis is another critical tool alongside chart patterns. Crypto markets react to announcements—from government regulations in Pakistan to global events like major exchange hacks or technological upgrades. Ignoring news-related drivers means risking trades based on price action alone, which can quickly prove misleading.
Suppose Pakistan’s State Bank announces tighter rules on crypto payments. Often, you’ll see sharp price drops that defy technical patterns, urging traders to pause and reassess rather than blindly follow charts. Thus, blending chart patterns with relevant news and indicators offers a fuller market picture and smoother trading experience.
Relying entirely on chart patterns without considering volatility, manipulation, and wider context can cost traders dearly, especially in Pakistan’s emerging crypto scene.
Pakistani crypto traders need to adapt chart pattern strategies according to the local market environment. Trading in Pakistan involves unique challenges such as exchange liquidity, regulatory changes, and limited local resources. Understanding these factors will help traders apply chart patterns more effectively and reduce exposure to risks.
Liquidity plays a vital role in crypto trading, especially on Pakistani platforms like Binance, Bitget, and local P2P services. Lower liquidity may cause larger price swings and slippage when executing orders, which can distort chart patterns or cause false breakouts. For example, if you spot a bullish flag on a low-volume token traded on a local exchange, the price movement might be exaggerated due to limited buyers.
Therefore, Pakistani traders should verify volume alongside chart patterns and prefer tokens with higher liquidity when planning trades. Look at order book depth and recent trade volumes before committing to positions. This habit helps avoid patterns invalidated by sudden spikes or crashes caused by thin trading activity.
Regulations around cryptocurrency are evolving in Pakistan. Announcements by the State Bank of Pakistan (SBP) or the Federal Board of Revenue (FBR) can create sharp moves affecting chart patterns unexpectedly. For instance, tighter KYC (Know Your Customer) rules or bank restrictions on crypto transactions can reduce market participation temporarily, weakening patterns' reliability.
It's crucial to stay updated on local regulatory news that can influence market sentiment and liquidity. Align your chart pattern analysis with these developments to avoid trading into sudden volatility triggered by policy shifts. Combining technical and fundamental awareness ensures trades are not just based on signals but grounded in the prevailing regulatory context.
Pakistani traders often rely on international platforms like TradingView for chart analysis due to its comprehensive tools and pattern recognition features. Local apps such as Binance’s mobile app and Bykea’s crypto wallet interface also provide quick access to real-time charts, helping traders monitor price action on the go.
Additionally, Easypaisa and JazzCash have started integrating crypto education into their platforms, offering basic market data. Using these tools together helps cross-verify patterns and reduces the risk of false signals. Combining global software with local apps offers accessibility and practical speed important in volatile crypto markets.
Several Pakistani crypto communities exist on Telegram, Facebook, and specialised forums where members discuss chart pattern strategies alongside regulatory updates. These platforms provide real-time insights and peer learning opportunities. Educational YouTube channels by Pakistani crypto experts also explain patterns in Urdu and English, making advanced concepts more accessible.
Engaging with these communities helps traders stay informed about emerging trends, scams, and local trading tips. Regular participation sharpens pattern recognition skills and provides confidence to act on signals within Pakistan’s unique crypto landscape.
By combining adaptation to local market conditions with familiar charting tools and active learning, Pakistani crypto traders can improve their chances of navigating this volatile market successfully.
📉 Learn to spot key bearish chart patterns that indicate falling trends. Get practical tips to manage risk & time your trades better in Pakistani markets.

📊 Learn key chart patterns in trading to spot market moves confidently. From reversals to continuations, improve your technical analysis skills today!

Explore seven essential chart patterns every trader should know 📈. Learn how to spot them, understand their meaning, and trade smarter with handy guides 📊.

🔍 Find the best cryptocurrency trading app for Pakistan! Learn about security, regulations, features, and top options for safe, easy trading. 💰📱
Based on 15 reviews