

Guide to Popular Chart Patterns in Trading
📊 Learn key chart patterns in trading to spot market moves confidently. From reversals to continuations, improve your technical analysis skills today!
Edited By
Jack Thompson
Cryptocurrency trading is no longer a niche hobby; it’s becoming a solid part of Pakistan’s financial scene. For anyone diving into crypto markets, understanding chart patterns is like having a map in the wilderness. These patterns help you spot trends early, figure out when to buy or sell, and avoid costly mistakes.
Chart patterns are essentially shapes formed by the price movements on a graph over time. They reflect the psychology of the market — where buyers and sellers are pushing prices up or down. By studying these patterns, you can get a clearer picture of what might come next rather than just guessing.
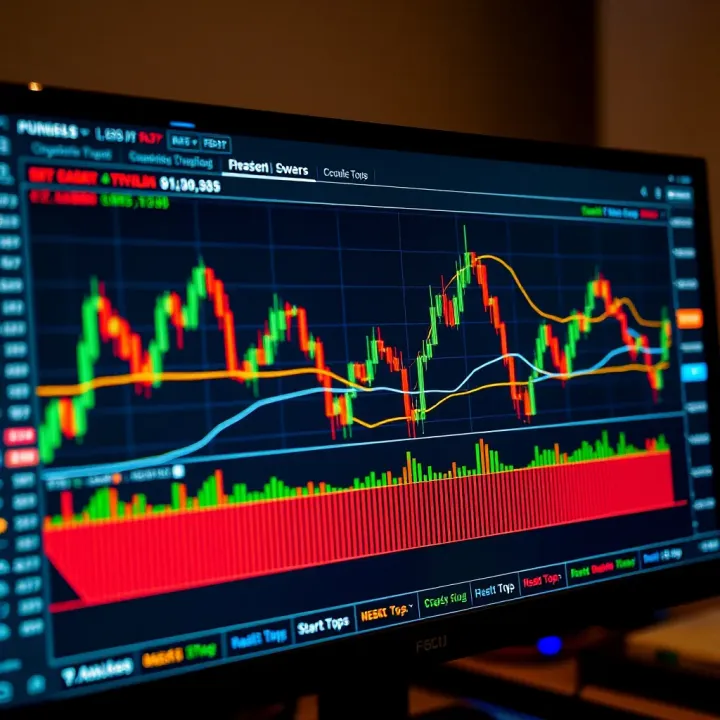
Some common chart patterns you will encounter include head and shoulders, double tops and bottoms, triangles, and flags and pennants. Each of these carries a different signal. For instance, a head and shoulders pattern might hint at a trend reversal, whereas a triangle could suggest the market is pausing before breaking out.
Recognising these patterns isn’t about magic; it’s about reading supply and demand through price action. This approach equips you with practical knowledge instead of relying solely on luck.
Since Pakistan’s crypto landscape is still developing, access to quality educational material can be limited. That’s why this guide provides free PDF resources to help you strengthen your practical skills. These PDFs include detailed diagrams and explanations to help you spot chart patterns clearly and quickly.
Predict Market Movements: Patterns give clues about where prices might move next.
Improve Entry & Exit Timing: Knowing when a pattern completes helps you choose the right moments to invest or sell.
Risk Management: By identifying patterns early, you can set stop-loss points to protect your capital.
Imagine you spot a double bottom pattern forming on Bitcoin’s price chart. This pattern usually signals a strong support level, hinting the price may rise soon. Acting on this, a trader might consider buying at that support point, reducing the risk of losing money.
By the end of this article, you’ll be comfortable with recognising these key patterns and using the free PDF guides to deepen your understanding. Whether you’re a student learning market basics or an investor planning your next move, this knowledge will sharpen your decision-making in Pakistan’s crypto market.
Cryptocurrency chart patterns are visual formations on price charts that traders use to predict future market movements. These patterns capture collective trader behaviours such as buying pressure, selling pressure, and market sentiment. Understanding these patterns can significantly improve your chances of making profitable trading decisions in Pakistan's fast-growing crypto market.
Crypto chart patterns are shapes created by the price movement of cryptocurrencies over time, such as Bitcoin or Ethereum, shown on a candlestick or line chart. They matter because they help traders identify potential trend reversals or continuations without relying solely on complex indicators. For instance, recognising a "Head and Shoulders" pattern might signal an upcoming bearish reversal, giving you the chance to sell before prices drop. This ability to anticipate market shifts reduces guesswork and helps protect your capital in a highly volatile market.
Reading chart patterns is like spotting signposts on the road ahead; they hint where the market might head next.
Incorporating chart patterns into your trading strategy allows you to time entries and exits more effectively. Suppose you notice a "Triangle" pattern forming during an uptrend; it usually indicates a continuation of the trend, meaning buying at the breakout could be rewarding. Conversely, ignoring patterns could lead to mistimed trades, resulting in losses. Many successful Pakistani traders combine chart patterns with volume analysis and support-resistance levels to confirm signals, making their strategies more reliable. This practical approach ensures you’re not merely reacting to sudden price swings but making informed decisions based on trend behaviour.
Using chart patterns helps manage risk as well by setting clear stop-loss points based on pattern boundaries. For example, if you buy on a breakout from a "Flag" pattern, placing your stop loss just below the flag’s lower boundary limits your downside risk. This method suits both day traders and longer-term investors who want a structured way to interpret volatile crypto charts commonly seen on platforms like Binance or Kraken.
In summary, understanding cryptocurrency chart patterns adds a valuable dimension to your trading toolkit. These visual cues, backed by real market behaviour, help Pakistani traders navigate unpredictable price shifts with more confidence and control.
Chart patterns provide traders with visual clues about potential price movements in cryptocurrencies. Understanding these patterns helps you identify when trends might reverse or continue, enabling better entry and exit decisions. This section covers common types of crypto chart patterns split into reversal and continuation categories, each with clear signs worth watching.
Head and Shoulders is a classic reversal pattern signalling a likely trend change from bullish to bearish or vice versa. It consists of three peaks: a higher middle peak (head) between two lower peaks (shoulders). For example, if Bitcoin's price forms this structure after an uptrend, it often predicts a downward reversal, meaning traders may consider selling or shorting. The inverse head and shoulders signals a potential shift from downtrend to uptrend, helping spot entry points for buying.

Double Top and Double Bottom patterns mark strong reversals too. A double top occurs when price hits a resistance level twice and fails to break higher, indicating a possible drop. Conversely, a double bottom shows two lows around the same support level, flagging potential upward movement. Suppose Ethereum price struggles twice near Rs 250,000 and drops afterwards, that forms a double top. Traders spot these patterns to anticipate trend shifts and act accordingly.
Triple Top and Triple Bottom are similar but show even stronger support or resistance levels, with three touches instead of two. While less common, they confirm the market’s inability to break certain price levels more clearly. For instance, Litecoin forming three similar highs before sharply declining confirms a triple top. This exclusivity often signals stronger reversal potential requiring traders to monitor closely.
Flags and Pennants indicate a brief pause before the existing trend resumes. Flags look like small rectangles slanting against the trend, while pennants are small symmetrical triangles. Imagine Bitcoin surging rapidly, then trading sideways inside a flag shape for a few days — this suggests the uptrend will continue once the flag ends. These patterns suit traders who prefer to ride prolonged trends safely.
Triangles take three main forms: ascending, descending, and symmetrical. They appear as converging trendlines showing tightening price action. An ascending triangle, with flat resistance but rising support, hints at a breakout upwards. Descending triangles suggest downward continuation. Symmetrical triangles could break either way but usually continue the prior trend. For example, if Binance Coin rallies then forms an ascending triangle, traders often expect another rise after breakout.
Rectangles form when price moves between parallel support and resistance levels, indicating consolidation within a range. This pattern means the market is pausing before picking a direction. Traders watch for breakouts above resistance or below support to guide their next trades. Suppose a cryptocurrency stays between Rs 50 and Rs 60 for several days, forming a rectangle — watching the breakout is key to position accordingly.
Recognising these common chart patterns gives you a tactical edge in trading. They reflect collective market sentiment and can improve timing decisions in Pakistan’s volatile cryptocurrency environment.
By mastering reversal and continuation patterns, traders gain clearer insight into price movements and avoid jumping into trades blindly. Always use these patterns alongside volume and other indicators to verify signals and manage risk effectively.
Interpreting chart patterns is vital for traders aiming to make informed decisions in Pakistan’s cryptocurrency market. Patterns provide visual clues about potential price moves, but reading them correctly separates successful trades from losses. It’s not enough to spot a pattern; understanding its context and confirming signals can improve precision and reduce risks.
Volume acts as a supporting cast to price patterns, revealing the strength behind moves. For example, a head and shoulders pattern breaking down with rising volume usually confirms a strong reversal signal. Conversely, if volume declines during a breakout, it often points to a false move or weak momentum. A trader seeing a double bottom pattern should look for increasing volume as prices bounce off support; this validates that buyers are stepping in decisively. Ignoring volume can lead you astray, as prices sometimes tick up or down on thin trading, especially in smaller Pakistani exchanges or during periods of low market activity like Ramadan evenings.
Chart patterns don’t work in isolation; combining them with support and resistance levels adds reliability. Support levels represent price floors where buying interest typically re-emerges, while resistance acts as a ceiling on price advances. Suppose a trader spots a triangle pattern approaching a well-known resistance level on the Binance chart. A breakout above this resistance, confirmed by the pattern, signals a strong buying opportunity. On the flip side, if price retests support repeatedly without breaking, it could indicate weakening bullish pressure despite pattern formations. Layering these tools helps Pakistani traders manage entry points and set stop-loss orders more effectively.
Many traders rush to act on chart patterns without confirming signals, leading to premature entries. A typical mistake is ignoring false breakouts—price may momentarily cross a trendline or pattern boundary before reversing sharply. Another error involves overreliance on patterns without considering broader market context like trending or sideways movements. For example, applying reversal patterns during a strong macro bullish trend in crypto assets like Bitcoin or Ethereum can cause missed opportunities. Lastly, neglecting timeframes matters; patterns on a 1-hour chart may not carry the same weight as those on daily or weekly charts. Pakistani traders should always combine pattern observation with disciplined risk management.
Successful crypto trading relies not just on spotting patterns but on interpreting them wisely with volume, support-resistance, and avoiding common pitfalls.
Clear understanding and cautious application of chart patterns can improve your chances of effective trades, especially within Pakistan’s dynamic crypto environment where volatility and sudden news often impact market behaviour.
Accessing free PDFs on crypto chart patterns is a practical way to deepen your understanding without spending money. These documents often provide detailed explanations, examples, and illustrations which are handy for traders aiming to interpret charts accurately. Having them saved offline also lets you study anytime, especially when internet is spotty or unreliable.
Official cryptocurrency exchanges frequently release guides and educational materials, including PDFs, to help their users trade better. For example, Binance and Coinbase offer downloadable manuals explaining basic to advanced chart patterns. These guides tend to be trustworthy since they're created by teams closely connected with market operations and updated regularly to reflect current trends. Following guidance from exchanges also helps you stay aligned with platform-specific charting tools and terminologies.
Established online education platforms focused on trading, like Investopedia and BabyPips, provide free PDFs and eBooks covering chart patterns comprehensively. These resources often break down complex concepts into easy steps with practical examples. Using such material adds value to your self-learning because it’s designed by experienced analysts familiar with market psychology. Pakistani traders can benefit especially by combining these global insights with local market conditions.
Online communities, forums, and social media groups related to crypto trading in Pakistan often share free PDF resources voluntarily. While some of these can be very insightful, it’s important to verify their accuracy before relying solely on them. Helpful communities on Telegram or Reddit sometimes circulate region-specific guides that discuss patterns alongside local market nuances. Engaging with such groups also opens chances to discuss doubts and share practical experience.
Downloading these PDFs is usually simple – official sites and educational platforms offer direct download buttons. However, it’s smart to keep an eye on file size and source credibility to avoid malware risks. Once downloaded, use PDF readers with annotation features so you can highlight important parts or add notes.
For better retention, combine reading PDFs with hands-on practice using charting software like TradingView or local exchange apps. Take notes on patterns you encounter in live charts and compare them with the descriptions in the PDFs. This approach reinforces learning and improves your confidence in identifying real trading setups.
The key is consistent study coupled with practical application. Free PDFs serve as excellent references but integrating knowledge through regular chart analysis is what truly sharpens trading skills.
By tapping into these free PDF resources, you can build a solid foundation in crypto chart patterns, making your trading strategies more effective and well-informed in Pakistan’s dynamic crypto market.
In Pakistan's crypto market, integrating chart patterns with practical trading strategies can significantly improve decision-making. Local factors such as regulatory developments, market sentiment, and trading volumes affect price movements. Therefore, understanding these alongside technical chart patterns helps traders avoid pitfalls and identify genuine opportunities.
Local market dynamics often influence crypto prices differently compared to global trends. For example, regulatory announcements by the Securities and Exchange Commission of Pakistan (SECP) or updates related to the State Bank of Pakistan's stance on digital assets can cause sharp volatility. Traders should keep an eye on news channels and social media to gauge sentiment, combining this with chart signals to confirm trade entries or exits.
Additionally, Pakistan experiences notable spikes in trading volume during festivals like Eid or significant national events when liquidity surges. Chart patterns during these periods may behave differently, sometimes producing false breakouts. Adjusting strategies to consider such seasonal factors ensures more reliable interpretation. For instance, a breakout pattern confirmed during low local participation might need extra caution compared to one during high-volume periods.
TradingView is a favourite among Pakistani traders due to its powerful charting features and affordability. It offers extensive crypto market coverage, including Bitcoin, Ethereum, and local exchange tokens. The platform’s clear interface allows users to plot common chart patterns, overlays, and indicators easily.
Importantly, TradingView’s social community lets traders share insights and scan charts for pattern confirmations, a helpful feature for those learning or seeking validation. Many Pakistani traders rely on its mobile and web versions to track real-time data without delay, which is critical when markets move fast.
Binance remains one of the most popular global crypto exchanges in Pakistan, partially due to its user-friendly app that integrates advanced charting tools. Besides basic candlestick charts, the app supports pattern recognition and indicator overlays directly within the trading interface.
Pakistani traders use the Binance app to monitor liquidity and volume changes on various trading pairs. Its fast execution and option to set alerts based on pattern formations help traders act decisively. Moreover, Binance frequently updates its app with educational content, which benefits beginners aiming to grasp practical chart analysis.
Several Pakistani crypto exchanges, such as Urdubit and Binance’s local affiliates, offer customised chart tools tailored for the local market. These platforms often provide easier deposit and withdrawal methods, including JazzCash and Easypaisa integration, lowering barriers for local users.
While their charting features might not be as advanced as TradingView or Binance, they incorporate essential patterns and trend lines crucial for day-to-day trading. Using local exchanges alongside international platforms helps traders compare price differences and spot arbitrage, which can be profitable given Pakistan's unique market conditions.
Combining international chart tools with local market awareness equips Pakistani traders to navigate the crypto space with greater confidence and accuracy.
📊 Learn key chart patterns in trading to spot market moves confidently. From reversals to continuations, improve your technical analysis skills today!

Explore key chart patterns in cryptocurrency trading 📉📈 to spot market trends accurately. Learn how to apply these patterns for better decisions in Pakistan's crypto market.
📈 Learn to spot and read key price action chart patterns for smarter trading decisions. Get practical tips and PDF resources to improve your market understanding in Pakistan.

📈 Learn how reversal chart patterns signal shifts in market trends, helping Pakistani traders spot when a rising or falling market might change direction for smart trading.
Based on 14 reviews