

Understanding Crypto Chart Patterns in Pakistan
📈 Learn key crypto chart patterns crucial for traders in Pakistan's market. Understand, interpret, and download free PDFs to enhance your trading strategy effectively.
Edited By
Oliver Bennett
Chart patterns form the backbone of technical analysis, guiding traders in predicting future price movements based on past data. For anyone venturing into trading in Pakistan, understanding these patterns is not just useful—it's necessary. Traders and investors often rely on chart patterns to identify potential entry and exit points in the market, helping to manage risks better.
There are various chart patterns you will encounter, including head and shoulders, double tops and bottoms, triangles, flags, and pennants. Each pattern reflects a specific market psychology and signals possible trends or reversals. For example, a head and shoulders pattern typically indicates a trend reversal from bullish to bearish, which can be crucial information during volatile market conditions.

Selecting the right book on chart patterns can accelerate your learning curve. A good book offers detailed explanations and visual examples along with the practical application of these patterns. Many Pakistani traders prefer books that also cover local market dynamics alongside international practices, as this blend helps bridge the gap between theory and the realities of trading on the Pakistan Stock Exchange (PSX) or currency markets.
Clear chart pattern knowledge helps you trade smarter, not harder, by giving you an edge in timing market moves.
When looking for chart patterns books, focus on ones that:
Include step-by-step pattern recognition methods
Offer case studies or examples from different market scenarios
Provide tips on integrating patterns within your risk management plan
Cater to different experience levels, especially beginners
Books like 'Encyclopedia of Chart Patterns' by Thomas Bulkowski or 'Technical Analysis of the Financial Markets' by John Murphy are among the classics. For traders in Pakistan, it's also worth exploring locally-written guides which reflect the nuances of regional markets.
In this article, you’ll learn to differentiate major chart patterns and discover how to pick books that fit your trading style and knowledge level. This foundation will empower you to analyse charts more confidently and make better trading decisions, whether you’re looking at stocks, forex, or commodities in Pakistan.
Chart patterns form the backbone of technical analysis for many traders in Pakistan and worldwide. They help in recognising recurring price behaviours on stock, forex, or commodity charts. Understanding these patterns allows traders to anticipate future price moves, improving decision-making and timing.
For instance, a trader spotting a "head and shoulders" pattern on the Pakistan Stock Exchange (PSX) may expect a potential trend reversal, signalling a good moment to sell. Thus, chart patterns serve as practical tools to interpret past price action and forecast what might happen next, blending art with analysis.
Chart patterns are formations created by price movements on charts. These formations, such as flags, triangles, or double tops, emerge when price action follows a certain shape over time. Traders study these to identify likely trends and reversals. For example, a flag pattern often hints that the prevailing trend will continue, while a double top may suggest the trend is about to flip.
These patterns reduce guesswork by offering a visual guide. A trader in Karachi following the PSX can use these patterns alongside volume and other signals to decide when to enter or exit. That’s why recognising them is a foundational skill for anyone serious about trading.
Chart patterns are not random; they mirror collective trader emotions like fear, greed, and hesitation. When buyers and sellers battle it out, their interactions create visible shapes on the chart. For example, a rising triangle may show buyers gaining confidence, pushing prices higher gradually.
Understanding this psychology helps traders read between the lines. When the market forms a reversal pattern, it often means traders are shifting from optimism to caution or vice versa. This insight goes beyond numbers and charts—it connects the technical with human behaviour.
Traders use chart patterns to forecast where prices might head next. These patterns offer clues on whether the price will continue its trend, pause, or reverse. For example, a pennant formation after a strong upward move often signals a continuation, while a head and shoulders hint at a downturn.
In Pakistan’s dynamic markets, where external factors like political changes or global commodity prices impact stocks, chart patterns provide a steady reference. They do not guarantee outcomes but improve probability, giving traders an edge in fast-moving situations.
Besides predicting moves, chart patterns aid traders in managing risk. By identifying specific points where patterns break, traders know when to cut losses or protect profits. For example, if a triple bottom pattern fails to hold, selling early prevents bigger losses.
Using chart patterns lets traders set stop-loss orders more precisely, which is crucial on volatile exchanges like PSX. It also discourages impulsive decisions by providing clear rules based on price behaviour. So, chart patterns become more than just analysis tools—they help protect capital and improve discipline.

Chart patterns combine technical signals with market psychology to help traders forecast movements and manage risk efficiently. Their clear visual cues make them indispensable for serious trading across global and Pakistani markets alike.
Chart patterns serve as a cornerstone for technical analysis, helping traders understand market sentiment and predict possible price movements. Knowing common chart patterns helps you spot opportunities whether the market is trending or correcting. These patterns offer practical benefits like signalling potential breakouts, trend continuations, or reversals, which makes them indispensable for managing risk and timing your trades.
Flags and pennants are short-term continuation patterns that appear after a sharp price movement, often representing a brief pause before the trend resumes. A flag looks like a small rectangle slanting against the prevailing trend, while a pennant forms a small symmetrical triangle. For instance, if a stock listed on PSX rallies sharply up and then forms a flag, there's a good chance the upward move will continue after the pattern completes. Traders watch volume carefully during these patterns—usually, it dips during the pause and then picks up as the trend restarts.
Triangles come in several forms — ascending, descending, and symmetrical. They signal consolidation phases where supply and demand forces balance before one side wins out. An ascending triangle, for example, has a flat resistance line with rising support, often leading to a breakout upwards. Many traders in Pakistani equity and forex markets rely on triangles for entry points, combining them with other indicators like moving averages. They are particularly useful during volatile periods, such as when political news affects market sentiment.
Head and shoulders is a classic reversal pattern signalling that an uptrend (or downtrend) is about to change direction. It forms with three peaks: the middle peak (head) is higher than the two shoulders. After the pattern completes and the neckline breaks, price often reverses significantly. This pattern is useful for traders wanting to exit positions before a downturn or enter short trades with clear stop-loss levels.
Double tops and bottoms indicate that a price tested a level twice but failed to break it, suggesting a shift in momentum. A double top looks like an 'M' shape, signalling resistance; whereas a double bottom resembles a 'W', signalling support. For example, on Karachi Stock Exchange charts, spotting a double bottom near support can help investors anticipate a bounce.
Triple tops and bottoms are similar but involve three peaks or troughs at roughly the same level, strengthening the reversal signal. Though less common, they suggest stronger resistance or support and often precede larger trend changes. Traders consider volume confirmation here too; declining volume across the pattern can affirm weakening momentum.
Rounding bottoms are long-term reversal patterns where the price forms a curved shape, signalling a gradual change from a downtrend to an uptrend. This pattern requires patience but is powerful for spotting substantial market shifts, often used by institutional investors and serious traders.
Cup and handle resembles a tea cup, where the cup is a rounding bottom followed by a smaller pullback (handle). It signals bullish continuation and is often seen in stocks before a breakout above resistance levels. This pattern helps traders plan entries with defined stop losses below the handle's low, reducing risk.
Understanding these common chart patterns gives Pakistani traders a practical toolkit for reading price action, improving decision-making, and managing risks effectively. Combining these visual cues with volume and timing ensures more reliable trades in dynamic markets.
Books on chart patterns play a vital role in helping traders sharpen their technical analysis skills. These resources offer structured learning that readers can follow at their own pace, which is especially useful for those trading in dynamic markets like Pakistan’s. Beyond just identifying patterns, books provide insights on how to interpret these signals within local market conditions, where factors like forex fluctuations and political developments can impact price movements.
Clear explanations with examples make complex concepts easier to grasp. A good book breaks down each chart pattern with straightforward language and supports the explanation with real trading examples. Imagine reading about a "head and shoulders" pattern but also seeing how it played out in the Pakistan Stock Exchange (PSX) or Karachi Cotton market. This method helps traders relate theory to practice and gain confidence before risking capital.
Inclusion of Pakistani market references is crucial because local markets have unique behaviours and volatility drivers. Books that mention Pakistani indices, commodities, or forex pairs provide a more practical viewpoint. For example, the influence of State Bank of Pakistan (SBP) policy announcements on chart patterns is a topic rarely covered in generic international books but essential for local traders.
Step-by-step guidance helps you apply what you learn to actual trading scenarios. Rather than just defining a pattern, good books will guide you through each stage: spotting the pattern, confirming with volume or moving averages, setting entry and exit points, and managing risk. This approach turns knowledge into actionable skills, reducing guesswork.
Building a solid foundation is probably the biggest benefit of reading on chart patterns. Instead of jumping straight into trading apps, books provide systematic grounding in technical analysis fundamentals. This foundation helps traders avoid rookie mistakes like confusing noise with meaningful signals, a common issue in the volatile Pakistani markets.
Access to expert insights is another advantage. Many chart patterns books are written by experienced traders or analysts who share tested techniques and lessons learned. These insights often include nuances not obvious from just watching price charts, such as subtle warning signs of pattern failure.
Reference material for ongoing learning means you always have a source to revisit when new patterns emerge or market conditions change. Markets don’t remain static; what worked last year might need adaptation today. Having a trusted book alongside your trading platform allows continuous improvement without relying solely on tutorials or market chatter.
Remember, no book guarantees success, but thorough study of chart patterns improves your chances by providing clearer signals and better risk control.
Using chart patterns books alongside daily practice can help develop sharp trading skills suitable for the complexities of Pakistan’s financial markets.
Choosing the right books can significantly improve your understanding of chart patterns, especially if you’re trading in Pakistan’s unique market environment. Books that offer not just theory but also hands-on examples help you apply concepts effectively. Keeping an eye on titles popular among traders worldwide, while considering local market conditions, will give you practical benefits for everyday trading.
Books by authors like Thomas Bulkowski and John J. Murphy are often the first recommendation for traders seeking deep insights into chart patterns. Bulkowski’s works, like Encyclopedia of Chart Patterns, provide statistical analysis and real-world examples drawn from various markets, which help readers understand the probabilities behind each pattern’s success or failure. John J. Murphy’s Technical Analysis of the Financial Markets is considered a cornerstone, explaining not only patterns but also how they fit into broader technical analysis strategies.
These classic titles remain relevant because they focus on fundamental principles that don’t change with market geography. While Pakistan’s stock exchange (PSX) has its quirks, the psychology behind chart patterns is universal. For instance, patterns like head and shoulders or double tops appear in Karachi stocks much as in international markets. The depth of these books encourages traders to develop a disciplined approach and avoid common pitfalls.
Books written for beginners usually use simple language and practical examples to break down complicated concepts. For a Pakistani trader just starting, this means you won’t get lost in jargon. They often include step-by-step instructions for recognising patterns, interpreting them, and making trading decisions. Examples drawn from everyday contexts, or Pakistani market data, tend to make the learning stick better.
Localised editions or recommendations are especially helpful. Some Pakistani authors or trainers have tailored pattern learning to local market conditions, considering factors like government securities or the effect of local economic news. These books or guides might also include easier access points to practical trading through platforms like PSX or Pakistani brokerage firms, making it simpler to transfer theory into practice.
Online bookstores and platforms such as Liberty Books, Readings, and local online marketplaces carry a range of chart pattern and technical analysis books. These platforms often let you check user reviews and sometimes provide Pakistani editions or more affordable copies. Given the occasional delays in physical stock availability, buying online is a practical option for many traders.
For those who prefer seeing books before purchase, local bookshops and markets in Karachi, Lahore, and Peshawar offer excellent places to find both international and homegrown titles. In Karachi’s famous Urdu Bazaar or Lahore’s Anarkali Bazaar, you might even find second-hand books covering the essentials of chart patterns. Visiting such markets allows you to get multiple titles in one trip and compare different approaches comfortably.
Investing time in the right chart pattern books can turn market observations into informed decisions, specialising your skills for Pakistan’s trading environment.
In the end, a combination of classic, beginner-friendly, and locally tailored books will best support your journey as a trader focused on chart patterns.
Applying chart pattern knowledge effectively can make a big difference in your trading results. Understanding patterns alone isn’t enough; combining them with other analysis tools and avoiding common mistakes enhances your chances of success. Plus, keeping track of your trades helps you improve continuously. Let’s look at some practical tips that Pakistani traders can use right away.
Volume analysis plays a key role in confirming chart patterns. Volume shows the number of shares or contracts traded during a price move. For instance, a breakout from a triangle pattern supported by higher-than-usual volume signals a stronger chance of continuation. In contrast, a breakout on low volume may suggest a false move. Traders in Pakistan can monitor volume easily on platforms like PSX or use tools provided by brokerage apps to get this extra confirmation.
Another helpful tool is moving averages. These smooth out price data to reveal trends more clearly. When a chart pattern aligns with moving averages — say, a bullish flag forming near the 50-day moving average — this confluence can reinforce a buy signal. Moving averages also act as dynamic support and resistance levels, making them handy to set entry or exit points alongside chart patterns.
One frequent pitfall is misinterpreting patterns. Traders might jump to conclusions seeing patterns where none exist or misunderstanding the pattern's nature. For example, mistaking a bear flag for a bullish pennant may lead to wrong trading decisions. It’s crucial to study patterns carefully in context, considering volume, time frame, and overall market conditions before acting.
Equally risky is overreliance on patterns without confirmation. Chart patterns alone don’t guarantee price directions; they indicate probabilities. Relying solely on a pattern’s shape without checking other indicators, news events, or market sentiment can backfire. Traders should confirm signals through volume, support/resistance, or momentum indicators before risking capital.
Recording pattern setups and outcomes helps traders learn what works best for them. Note details like the pattern type, entry and exit points, stop-loss levels, and trade outcome. This not only makes trading more disciplined but uncover patterns in your own behaviour or market responses.
Learning from successes and failures is simpler when you have a trading journal. Reviewing past trades reveals if certain patterns work better in the Pakistani market or under specific conditions. For instance, you might discover that double bottoms perform well during bullish phases in PSX stocks but fail during heavy news volatility. This insight guides smarter decisions moving forward.
Keeping a detailed trading journal is like having a personal mentor—it sharpens your skills and helps avoid repeating mistakes.
Together, these practical tips form a solid foundation to trade chart patterns confidently, minimise risks, and sharpen your edge in Pakistan’s dynamic markets.
📈 Learn key crypto chart patterns crucial for traders in Pakistan's market. Understand, interpret, and download free PDFs to enhance your trading strategy effectively.

📊 Learn key chart patterns in trading to spot market moves confidently. From reversals to continuations, improve your technical analysis skills today!

Explore key chart patterns in cryptocurrency trading 📉📈 to spot market trends accurately. Learn how to apply these patterns for better decisions in Pakistan's crypto market.
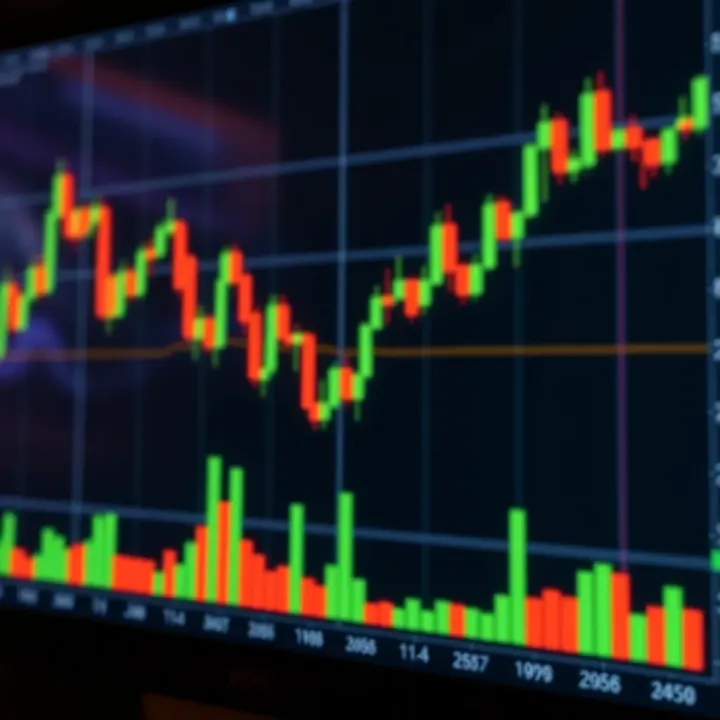
📈 Learn to spot and read key price action chart patterns for smarter trading decisions. Get practical tips and PDF resources to improve your market understanding in Pakistan.
Based on 12 reviews