

Guide to Powerful Candlestick Patterns with PDF
Master key candlestick patterns 📈 Learn to interpret market moves and boost your trading skills. Download your free PDF with 35 essential patterns now! 📊
Edited By
Mia Thompson
Japanese candlestick patterns serve as a vital tool for traders aiming to read and predict market movements effectively. These visual cues summarise price action within a specific timeframe, making complex data accessible at a glance. For those involved in the stock market, forex, or commodities, understanding these patterns can sharpen decision-making processes and reduce risks.
Candlesticks consist of a body and wicks (or shadows) that reflect opening, closing, high, and low prices. The body’s colour—commonly green or white for upward movement, and red or black for downward—shows the direction of the price change. Traders watch for specific shapes and formations that often signal potential market reversals or trend continuations.
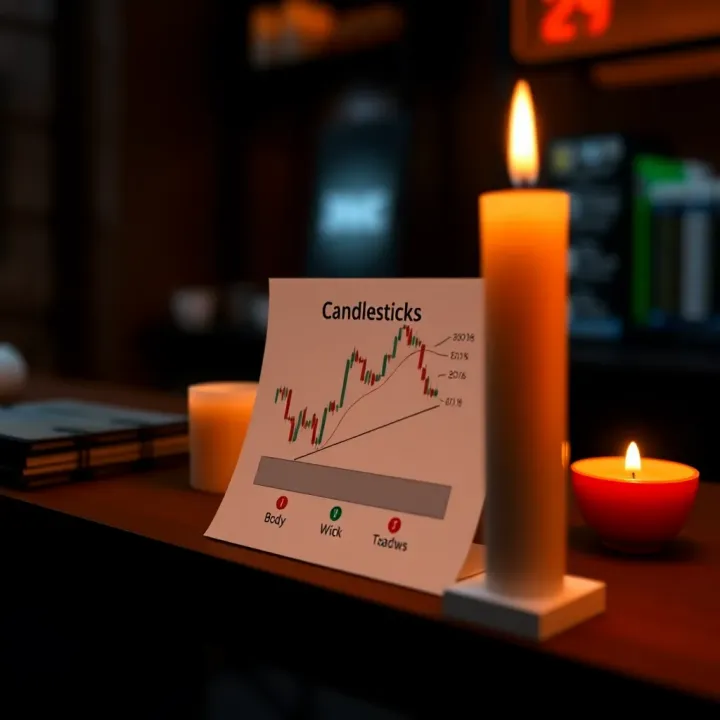
Recognising these patterns early can give traders an edge, enabling timely entry or exit from trades.
To get practical with Japanese candlestick patterns, you’ll benefit from a well-organised PDF guide that breaks down common formations like Doji, Hammer, Engulfing, and Shooting Star. Such resources usually explain how each pattern behaves under different market contexts and interactions with volume or support and resistance levels. Having a reference PDF handy helps when you want to quickly confirm what a candle pattern might indicate without flipping through multiple sources.
Here are the key takeaways when using these patterns:
Patterns reflect market psychology; for example, a Hammer indicates buyers are stepping in after sellers pushed prices down.
No pattern guarantees success, so combine candlestick signals with other analysis tools.
Size and location of the candle within a trend matter; a small-bodied Doji after a strong uptrend can mean indecision.
In Pakistan’s trading scene, where markets can be volatile and influenced by macroeconomic factors, candlestick patterns provide a simple, visual approach for local and foreign investors to gauge market sentiment quickly. Using these patterns alongside fundamentals such as news or earnings reports can improve your trading confidence and outcomes.
This guide aims to equip you with the knowledge to identify, interpret, and apply Japanese candlestick patterns effectively. Downloading a reliable PDF guide will support ongoing learning and quick access during your trading routine.
Grasping the fundamentals of Japanese candlesticks is essential for any trader looking to read market trends more effectively. These candlesticks provide a visual summary of price movements during specific time periods, helping traders identify potential trading opportunities and make timely decisions. Without a clear understanding of their structure and meaning, even the best trading strategies can suffer from guesswork.
Japanese candlesticks originated in Japan centuries ago, initially used by rice traders to analyse price action. Unlike plain line charts, candlesticks offer a richer presentation by showing open, close, high, and low prices within a specific interval — whether it’s a minute, an hour, a day, or longer. This makes them practical for diverse trading styles, from day trading to long-term investing.
Each candlestick represents price movement over the chosen period. Collectively, they form patterns which can hint at market sentiment and possible future price direction. For instance, a series of candlesticks forming an engulfing pattern often signals a reversal in trend.
A Japanese candlestick consists of three main parts: the body, the wick (or shadow), and the tail (also considered a shadow). The body shows the price range between the opening and closing levels. If the closing price is higher than the opening, the body is typically coloured green or white, representing bullish sentiment. Conversely, a red or black body indicates the closing price was lower, meaning bearish sentiment.
The wick or shadow represents the highest and lowest prices reached in that time frame. Long wicks suggest volatility or indecision among traders, while short wicks often signal a clear direction. For example, a hammer pattern has a small body with a long lower wick, hinting buyers stepped in strongly near the low.
Candlesticks provide quick clues about whether buyers or sellers dominate the market. A bullish candle, where prices close higher, suggests buying strength. On the other hand, bearish candles show selling pressure. Traders look for clusters of these candles to judge trend continuation or reversal.
Remember, a single candle rarely tells the whole story. Patterns formed by multiple candlesticks offer more reliable signals about market behavior.

Each candlestick summarises four key prices for its timeframe. The open price is where trading began, and the close price is where it ended. These two determine the candle’s body size and colour, reflecting overall sentiment.
The high and low prices form the wicks, marking extremes during that period. Understanding these helps spot rejection levels or price tests. For instance, if the price reaches a high but closes near the open, it indicates sellers pushed back, forming a bearish pressure point.
By focusing on these components, traders can interpret subtle cues that indicate whether a price move has strength or is losing momentum. This insight helps improve trade timing and risk management.
With the basics clear, traders can now move on to recognising specific candlestick patterns and applying them to real trading setups.
Understanding common Japanese candlestick patterns is vital for traders to interpret market signals effectively. These patterns reflect shifts in market sentiment and help identify potential trend reversals or continuations. By recognising such patterns, you can make more informed decisions about entry and exit points, reducing risk and enhancing profit potential.
A Doji forms when the opening and closing prices are almost the same, producing a very small or non-existent body with long wicks. It signals market indecision and a possible reversal, especially if it appears after a strong trend. For example, after a sustained upward rally in the PSX, a Doji suggests buyers and sellers are at a stalemate, warning traders to watch for upcoming changes.
Similarly, the Spinning Top has a small body with longer shadows on both sides, indicating uncertainty. It shows that neither bulls nor bears have full control. In practical trading, spotting a Spinning Top at resistance or support levels can hint at a weakening trend, prompting traders to tighten stop-loss orders or prepare for a shift.
A Marubozu is a strong candlestick with no shadows. A bullish Marubozu opens at the low and closes at the high, indicating continuous buying pressure. A bearish Marubozu is the opposite, signalling strong selling. For instance, a bullish Marubozu in a rising oil stocks chart on KSE can confirm bullish momentum.
The Hammer, appearing after a downtrend, has a small body and a long lower wick, resembling a hammer. It shows sellers pushed the price down but buyers regained control by closing near the open. This pattern is a practical buy signal if confirmed by following candles, useful for traders unsure about an oversold market.
The Bullish Engulfing pattern happens when a small bearish candle is followed by a larger bullish candle that 'engulfs' the previous body. It suggests buyers overpower sellers and often marks a trend reversal. Conversely, the Bearish Engulfing pattern shows a small bullish candle engulfed by a larger bearish one, hinting at downward pressure ahead. Traders use these patterns in Pakistan’s volatile markets to time entries, especially near key support and resistance.
The Morning Star is a three-candlestick pattern signalling a bullish reversal. It starts with a bearish candle, followed by a small-bodied candle (indecision), and finishes with a strong bullish candle closing well into the first candle’s body. For example, after a slump in textile shares, this pattern may suggest a turnaround.
In contrast, the Evening Star signals a bearish reversal after an uptrend, with the middle indecision candle followed by a strong bearish candle. Recognising these patterns helps traders spot trend exhaustion early.
The Harami pattern shows a large candle followed by a smaller one completely within its range. A Bullish Harami appears in a downtrend and suggests weakening selling pressure. A Bearish Harami in an uptrend warns that buyers may be losing strength. Traders find Haramis useful as early warnings before bigger reversals, especially when volume supports the pattern.
Recognising these common candlestick patterns can significantly improve your trading accuracy by signalling shifts before they fully unfold. Always combine them with other tools like volume or support levels for best results.
Japanese candlestick patterns help traders in Pakistan read market behaviour and make informed decisions. They don't work in isolation but become far more reliable when woven into broader trading strategies. Whether you trade shares on the Pakistan Stock Exchange (PSX) or commodities like gold and oil, recognising these patterns offers a window into the market's mood.
Identifying trend strength is vital for knowing if a price movement has the momentum to continue. For instance, a long-bodied bullish candlestick following a series of smaller candles suggests strong buying pressure. Conversely, if successive candles show shrinking bodies, it signals weakening momentum. This helps traders decide if they should hold onto a position or prepare for a potential stall.
Spotting reversal signals can save traders from costly mistakes. Classic patterns like the Morning Star or Engulfing pattern often mark the end of a downtrend and the start of an upswing. For example, if you see a Hammer candlestick after a decline in oil prices, especially near a known support level, it hints that buyers may be stepping back in. This insight allows traders to enter or exit trades more confidently, minimising risks.
Support and resistance levels act as price barriers, where market sentiment often shifts. Candlestick patterns become more trustworthy when they appear near these levels. For example, an Evening Star candlestick close to a resistance line on a PSX stock chart signals a likely price drop. This combination sharpens entry and exit points, which is critical amid Pakistan's volatile markets.
Volume and moving averages add depth to candlestick analysis. High trading volume on a bullish engulfing pattern signals strong conviction behind the move, suggesting the trend will last. Moving averages, like the 50-day simple moving average, provide dynamic support or resistance. If a candlestick pattern aligns with a moving average bounce, such as a Spinning Top near the 50-day line, it confirms market hesitation and potential trend change. For traders using platforms like HBL Konnect or Easypaisa for market updates, integrating these signals can improve trade timing.
Successful trading goes beyond spotting candlestick patterns—it’s about using them alongside other technical tools to validate moves and make confident decisions.
By blending candlestick patterns with trend analysis and other indicators, Pakistani traders can read the market more clearly and reduce guesswork. This strategic approach is key given the ups and downs in local and global markets affecting Pakistan’s economy.
Accessing authentic and reliable Japanese candlestick patterns PDFs is crucial for traders who want to improve their understanding of market movements and sharpen their trading strategies. These PDFs serve as handy references that compile technical insights, pattern recognition techniques, and practical trading tips in one place. By choosing trustworthy sources, you avoid misleading or shallow content that could lead to poor investment decisions.
Brokerage and trading education websites often provide valuable, free PDFs on Japanese candlestick patterns. These platforms understand what practical knowledge traders need and usually offer guides developed or vetted by experienced analysts. For example, leading Pakistani brokers like MCB Arif Habib Savings & Investments or international platforms operating in Pakistan regularly publish educational materials tailored to the local market conditions, such as how candlestick patterns react during high-volatility periods on the Pakistan Stock Exchange (PSX). These PDFs often include updated examples relevant for Pakistan’s trading environment, making them more actionable.
Financial training platforms relevant to Pakistan also play an important role. Organisations such as Invest Academy Pakistan or online portals like the Pakistan Institute of Capital Markets offer structured trading courses and downloadable PDFs. Their materials usually blend theory with real case studies from local equities or commodities markets. This context helps traders grasp how Japanese candlestick patterns apply in Pakistan’s unique economic setting, including factors like fluctuating rupee exchange rates or government policies affecting market sentiment.
Checking author credibility is essential when picking your PDF. Look for materials written by recognised market experts or experienced traders with a transparent track record. Verified authors often include credentials like Chartered Financial Analyst (CFA) certification, years of trading experience, or association with reputable institutions. Avoid anonymous PDFs or documents without clear authorship since those often lack depth or accuracy and may reflect outdated information.
Looking for practical examples and illustrations in the PDFs greatly enhances their usefulness. Candlestick patterns are visual by nature, so guides packed with clear charts showing real market data and step-by-step explanations help cement understanding. For instance, a PDF that compares bullish engulfing patterns on the PSX benchmark index KSE-100 during market rallies offers much more value than vague descriptions. Illustrated examples of trades, complete with entry and exit points, equip readers to apply these patterns confidently in their own trading.
The takeaway is to prioritise PDFs that combine expert insight with actionable visuals and local market relevance, ensuring you can translate learning directly into better trade decisions.
Choosing the right guides will save you time and effort, making your trading journey more efficient and less prone to costly mistakes.
Master key candlestick patterns 📈 Learn to interpret market moves and boost your trading skills. Download your free PDF with 35 essential patterns now! 📊

📉 Learn how bearish candlestick patterns signal market drops, helping traders in Pakistan spot trends, manage risks, and improve timing in trades.

📊 Master key candlestick patterns for trading in Pakistan with our detailed guide. Access reliable PDF resources for deep insights and smart market moves!
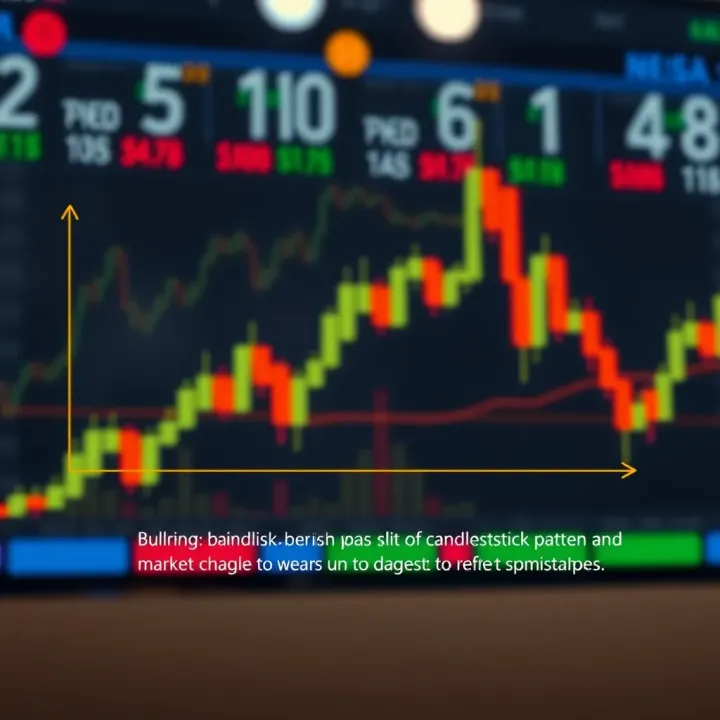
📈 Master candlestick patterns from single to complex forms to better read market psychology and predict price moves in Pakistani and global markets.
Based on 11 reviews