
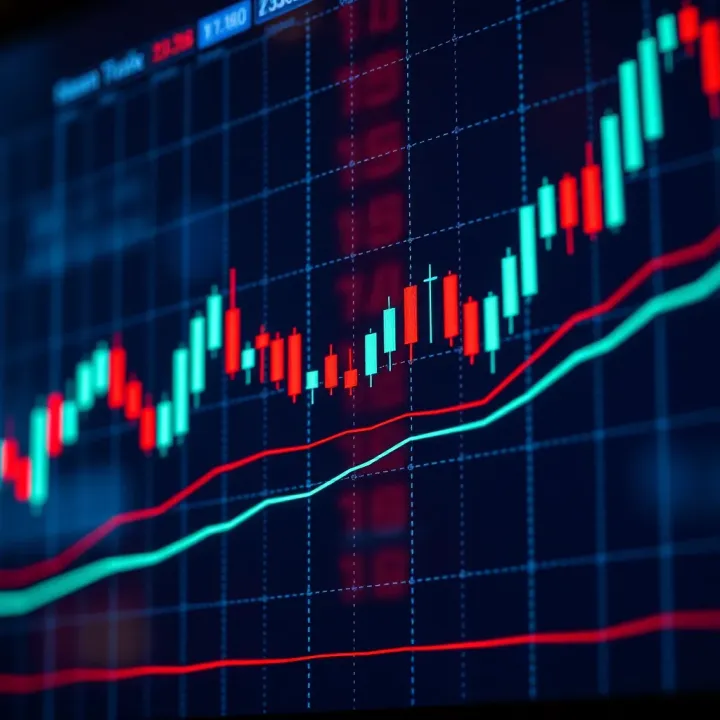
Understanding Candlestick Patterns in Forex Trading
📈 Master key candlestick patterns in forex trading to enhance your price analysis and decision-making skills in Pakistan's dynamic forex market. 🇵🇰
Edited By
Benjamin Scott
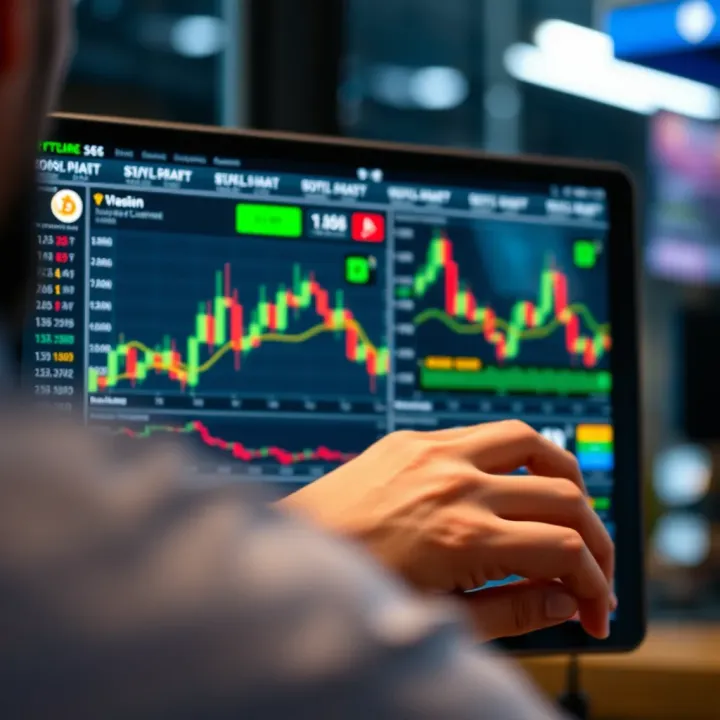
Cryptocurrency trading in Pakistan has gained popularity recently, and understanding price patterns is essential for smarter trading. Candlestick charts are one of the most effective tools traders use to assess price movements over time. They provide clear visual cues that reveal market sentiment, helping traders anticipate potential trend reversals or continuation.
Each candlestick summarises four key price points within a specific time frame: the opening price, closing price, highest price, and lowest price. The body of the candlestick represents the price range between the opening and closing moments, while the wicks (or shadows) show the extremes reached during that period.
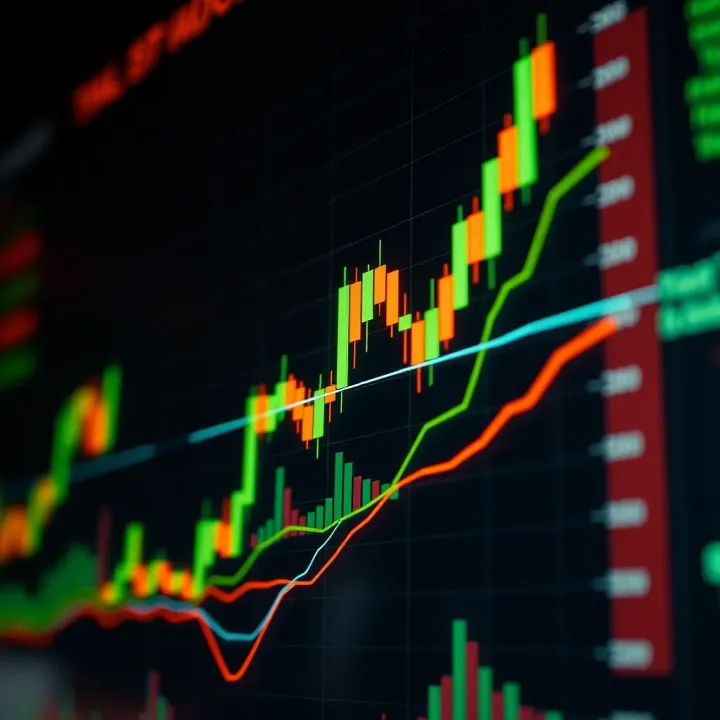
Recognising common candlestick patterns can improve your ability to spot buying or selling pressure early. Some widely observed formations include:
Doji: A candle where the opening and closing prices are almost the same, signalling market indecision.
Hammer: A short body with a long lower wick, suggesting a potential bullish reversal at support levels.
Shooting Star: Opposite to hammer, often signalling bearish reversals after an uptrend.
Engulfing Patterns: Where a larger candle fully covers the previous small candle, indicating a possible shift in trend.
Using these patterns in crypto trading lets you identify entry and exit points strategically, rather than relying solely on guesswork or hearsay.
In the volatile cryptocurrency market, especially with coins like Bitcoin, Ethereum, or local interest tokens, candlestick patterns provide a practical way for Pakistani traders to read the mood of the market. They work best when combined with other indicators or trend analysis methods, such as moving averages or volume data.
This article aims to break down these patterns clearly with examples relevant to Pakistan's crypto market. By learning to interpret these signals, you can refine your trading strategy, reduce risks, and make informed decisions that suit your investment goals and risk appetite.
Understanding candlestick charts is fundamental for anyone involved in crypto trading in Pakistan. These charts offer a visual snapshot of price movements during specific periods, allowing traders to quickly gauge market behaviour and plan their trades. Unlike line charts that simply connect closing prices, candlestick charts reveal additional details like opening price, highest and lowest levels, and closing price — making them richer tools for market analysis.
Candlestick charts originated from Japanese rice traders in the 18th century, introduced by Munehisa Homma. They went beyond simple price tracking by visually representing buying and selling pressure within a given timeframe. Today, crypto traders use them to spot patterns that indicate potential market direction.
Practically, a single candlestick summarises how a cryptocurrency performed in a set period — this could be one minute, an hour, or even a day. For example, if Bitcoin was traded on Binance from 10 am to 11 am, a candlestick would show the opening price at 10 am, the highest and lowest prices during that hour, and the closing price at 11 am. By lining up these candlesticks in sequence, you get a clearer overview of price trends.
A candlestick consists of two main parts: the body and the wick (also called shadow). The body displays the opening and closing prices; if the close is higher than the open, the body is usually coloured green (or white), signalling a price rise. A red (or black) body means the price fell during that period.
The wicks extend above and below the body to mark the highest and lowest prices reached. These extremes are crucial for understanding volatility. For instance, a long upper wick on Ethereum’s candlestick might indicate buyers pushed the price up, but sellers forced it back down before closing, hinting at resistance near that level.
Candlestick patterns reflect the emotions and psychology of traders in the market. At a glance, these patterns tell a story about supply, demand, fear, and greed, all of which drive price action. Recognising these signals helps traders make informed decisions rather than relying on guesswork.
For example, a pattern like the bearish engulfing indicates that sellers have overwhelmed buyers, suggesting a price drop might follow. In Pakistan’s crypto market, where sudden market swings are common due to news, policy changes, or large trades on platforms like Binance or local exchanges, being able to spot these signals can save you from losses or help lock in profits.
Candlestick analysis suits crypto trading due to the market’s inherent volatility. The frequent price swings make conventional trend analysis less reliable on its own. Candlestick charts capture real-time tensions between bulls and bears more effectively. They also adapt well to different timeframes, whether you’re a day trader checking 15-minute charts or a long-term investor inspecting daily or weekly candles.
Using candlestick patterns alongside volume or other technical indicators like the Relative Strength Index (RSI) can provide a stronger confirmation, improving your trade accuracy especially in Pakistan’s volatile trading environment.
In brief, mastering the basics of candlestick charts is essential for anyone serious about crypto trading. It empowers you with a clearer, more dynamic view of market behaviour, helping you stay ahead of rapid price changes and trade with greater confidence.
Bullish candlestick patterns are essential signals for traders looking to identify potential price rises in cryptocurrency markets. These patterns help highlight when buyers are gaining control, often marking a shift from a downtrend to an upward movement. Recognising these signs early can give traders an edge, especially in volatile markets like crypto, where timing is critical.
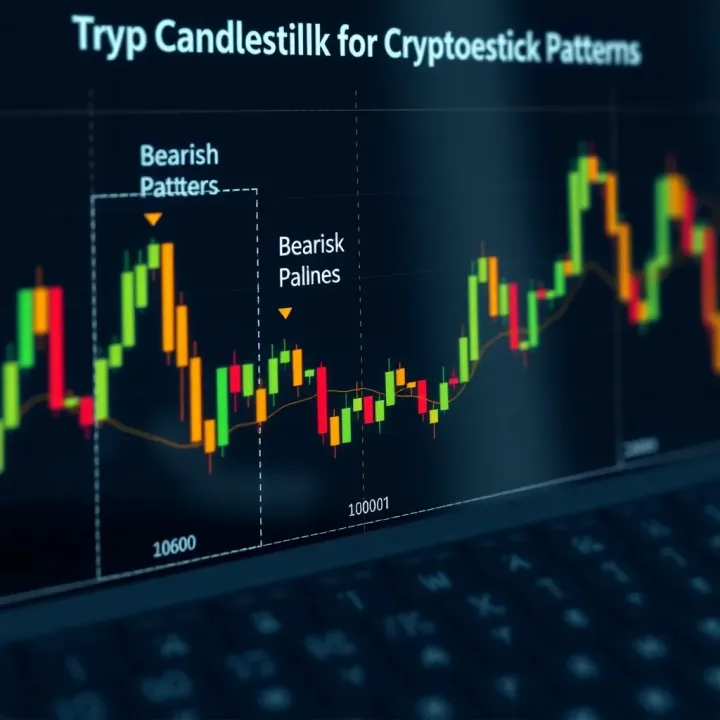
The hammer forms when a candle has a small body at the upper end and a long lower wick, often at least twice the body length. This setup means sellers pushed the price down during the session but buyers stepped in strongly, driving it back near the open by close. The inverted hammer is similar but displays a small body at the bottom with a long upper wick, hinting at potential buying strength despite an initial sell-off.
Both hammers typically appear after a decline, representing possible support levels. Their practical relevance lies in signalling a slowing down of selling pressure and hinting at potential price reversals. In real terms, if Bitcoin on a local platform shows a hammer pattern after several bearish sessions, traders may see that as a buying opportunity, anticipating the price to rise.
This pattern occurs when a small bearish candle is immediately followed by a larger bullish candle that completely engulfs the previous body. The bullish engulfing pattern reflects a sudden surge in buying interest overpowering sellers, often after a downtrend.
Its significance is most visible during trend reversals. For example, in a Karachi-based crypto trading platform, if Ethereum’s chart shows a bullish engulfing after a slump, it indicates buyers stepping in aggressively. Traders trust this pattern as an early signal that prices may continue upwards, though confirmation through volume or other technical indicators adds reliability.
The morning star spans three candles: a long bearish candle, a small-bodied candle (could be bullish or bearish), and then a strong bullish candle. The middle candle represents indecision and a pause in the downtrend, while the final bullish candle signals buyers gaining momentum.
This pattern is particularly useful for confirming a reversal from a bearish to bullish trend. In Pakistan’s crypto markets, spotting a morning star pattern on Bitcoin or Binance Coin charts could suggest a good entry point, especially when combined with rising trading volume. This three-step visual gives traders more confidence before committing capital, reducing risk compared to relying on a single candle alone.
Recognising these bullish patterns can shape more informed strategies, helping traders spot opportunities early and handle market volatility with greater confidence.
Understanding and applying these candlestick patterns wisely can increase your chances of successful trading in Pakistan’s fast-moving cryptocurrency market.
Understanding bearish candlestick patterns helps traders spot when the market sentiment might be shifting towards selling pressure. These patterns signal possible trend reversals or continuations, which is vital for protecting profits or avoiding losses in volatile crypto markets like those in Pakistan.
Visual features: The shooting star has a small body near the candle's low, with a long upper wick at least twice the size of the body. This forms after a price rise, showing that buyers pushed the price higher but sellers regained control before the close.
Warning of possible downtrend: When a shooting star appears after an upward trend, it suggests the uptrend is losing steam. It hints that sellers are gaining strength and a price drop might follow. For example, if Bitcoin on a local exchange shows a shooting star on daily charts, traders might prepare for a pullback or adjust stop losses.
Pattern details: This pattern appears over two candles. The first candle is usually bullish (green or white), and the second is a larger bearish candle that completely covers or “engulfs” the previous one’s body. This signals a strong shift in momentum from buyers to sellers.
Interpretation as selling pressure: The bearish engulfing pattern shows increased selling pressure, often leading to further decline. For instance, if a crypto like Ethereum on Pakistani platforms forms this pattern after a short rally, sellers may dominate soon, making it a warning to traders not to enter long positions without caution.
Structure of the pattern: It consists of three candles—a large bullish candle, a small-bodied candle (can be bullish or bearish), and a large bearish candle. The small candle shows indecision, and the large bearish candle confirms sellers gaining control.
Indication of bearish reversal: The evening star signals a potential trend reversal from bullish to bearish. In the Pakistani crypto market, spotting this pattern early can help traders secure profits before a decline or plan short trades. For example, after a steady rise in price, an evening star formation may indicate that bears are ready to push prices down.
Recognising these bearish patterns allows traders to read market sentiment and anticipate price shifts, crucial for better risk management in Pakistan's volatile crypto trading scene.
Candlestick patterns offer valuable snapshots of market sentiment, but using them alone can lead to misleading signals. Combining these patterns with other technical indicators and robust risk management strategies helps traders in Pakistan’s volatile cryptocurrency market make smarter decisions.
Candlestick patterns by themselves show price action, but indicators like the Relative Strength Index (RSI), Moving Average Convergence Divergence (MACD), and volume provide extra layers of insight. For example, if a bullish engulfing pattern forms but the RSI signals overbought territory, traders might hesitate to enter immediately. Similarly, a bearish shooting star pattern confirmed by a bearish crossover in MACD gives a stronger sell signal.
Volume analysis further helps confirm the strength of these patterns. A sudden spike in volume during the pattern’s formation usually means genuine interest from buyers or sellers, making the pattern more reliable. For instance, on Pakistani crypto trading platforms like Binance Pakistan or local exchanges such as CoinMena, traders often watch volume alongside candlesticks to validate entry or exit points.
False signals are common in crypto markets, especially during high volatility. Relying solely on candlestick patterns can result in costly mistakes. Confirmation from other technical signals or waiting for price to pass a certain level helps avoid premature trades. For example, after spotting a morning star pattern, a trader may wait for the price to move above the middle candle’s high before buying.
Setting stop-loss and take-profit levels is vital. These protect from bigger losses and secure profits when the market swings unexpectedly. When a bearish engulfing pattern forms near resistance, a stop-loss just above the high of the engulfing candle limits risk if the trend reverses bullishly. On the other hand, take-profit levels can be set at support zones or previous swing lows/highs to lock gains systematically.
Local trading platforms show how these concepts apply in real situations. For example, during a sharp BTC rally on Binance Pakistan in early 2024, several traders noticed bullish candlestick patterns confirmed by rising volume and positive MACD crossovers. Those who combined these indicators typically avoided rash decisions during minor pullbacks.
Recent price movements also reflect the influence of news and regulations from the State Bank of Pakistan (SBP) and Securities & Exchange Commission of Pakistan (SECP). For example, an announcement regulating crypto exchanges caused volatile bearish patterns, highlighting the need to combine candlestick analysis with current events. Traders in Pakistan learned to look beyond patterns, considering the broader picture alongside technical signals.
Combining candlestick patterns with indicators and sound risk management transforms guesswork into an informed strategy, especially crucial in Pakistan’s fast-changing crypto markets.
This approach enables you to read the charts more confidently and manage your trades with discipline, which ultimately improves your chances of success.
Candlestick patterns are a popular tool among traders, but relying on them alone can mislead your investment choices. Understanding their limitations helps you apply these patterns more effectively, especially in Pakistan’s volatile crypto markets. This section highlights challenges such as sudden market shocks and the need to complement patterns with other analysis methods.
Cryptocurrency markets are famously volatile, often reacting sharply to news, government regulations, or sudden global events. For example, when Pakistan’s State Bank announced tighter regulations on crypto transactions, price charts showed erratic movements that candlestick patterns alone could not predict reliably. Such external factors can cause sudden spikes or drops that disrupt the usual pattern formations, making them fail to signal trends correctly.
In practical terms, this means traders must stay alert to news updates, such as policy shifts by the Securities and Exchange Commission of Pakistan (SECP) or announcements related to Pakistan Telecommunication Authority (PTA) guidelines affecting crypto platforms. Ignoring these can cause a trader to misinterpret a candlestick pattern, leading to poor timing in buying or selling.
While candlestick patterns provide valuable insights, they should not be the only reference for trading decisions. Combining technical tools like moving averages or RSI (Relative Strength Index) with fundamental analysis gives a fuller picture. For instance, understanding how global economic indicators or Pakistan’s foreign exchange situation influence crypto prices can prevent a trader from making mistakes based solely on price charts.
Additionally, fundamental factors such as the adoption rate of cryptocurrencies in Pakistan, government tax policies as monitored by the Federal Board of Revenue (FBR), or technological upgrades by crypto exchanges like Binance or local platforms play a big role. These elements might not show directly in your candlestick charts but affect long-term price trends.
Relying only on candlestick patterns is like navigating a ship by watching waves without checking the weather forecast—both are needed for a safe passage.
Understanding these limitations allows you to combine pattern recognition with broader market knowledge. This approach improves your ability to make smarter, more resilient trading decisions in Pakistan’s dynamic crypto environment.
📈 Master key candlestick patterns in forex trading to enhance your price analysis and decision-making skills in Pakistan's dynamic forex market. 🇵🇰

Explore crypto trading courses designed for Pakistani investors 🇵🇰. Learn key topics, start trading safely, and overcome challenges in Pakistan’s crypto scene 📈💡.
Find the best crypto trading platform in Pakistan 🇵🇰 with expert tips on security, fees, regulations, and popular options to trade confidently today! 💰
Explore top crypto trading platforms for Pakistani users 🇵🇰! Learn how to pick secure, legal options that match your trading style and needs 💰🔒
Based on 10 reviews