
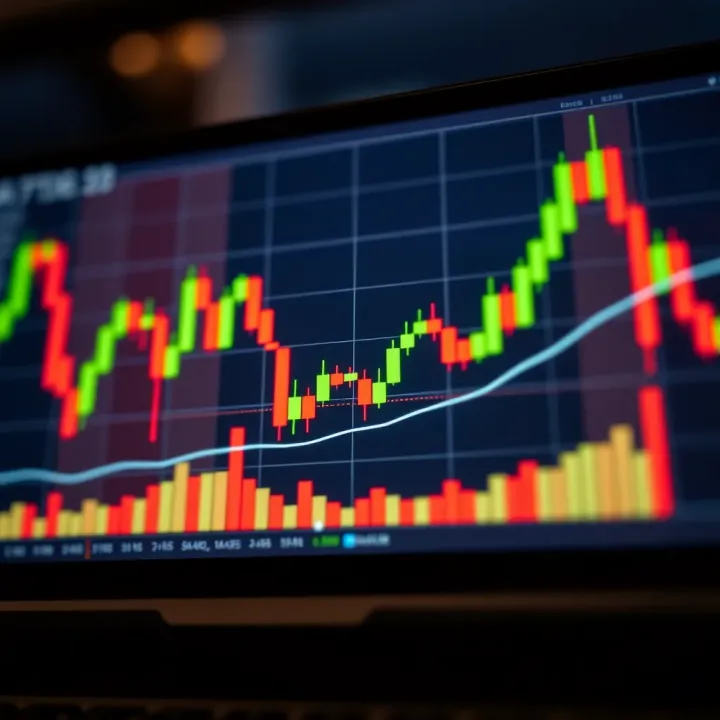
Understanding Price Action Candlestick Patterns
Learn how price action candlestick patterns reveal market trends for smarter trading decisions 📊. Ideal guide with PDF resources tailored for Pakistani traders 🇵🇰.
Edited By
Charlotte Hayes
Gold's price per ounce is one of the most closely watched statistics in both the financial world and consumer markets. It influences everything from jewelry costs to the value of investment portfolios.
The ounce price of gold refers to the cost of one troy ounce of pure gold, which is about 31.1035 grams. Unlike everyday ounces, the troy ounce is the standard measurement for precious metals. Investors and traders pay close attention to this price, which is quoted continuously during market hours.
This price doesn't appear out of thin air—it results from a mix of supply and demand dynamics in global markets. Major exchanges like the New York Mercantile Exchange (NYMEX) and the London Bullion Market set benchmarks that influence the spot price of gold. These rates reflect the latest transactions and contracts made in these markets.
Factors driving the gold price include geopolitical tension, inflation trends, currency fluctuations, and interest rates. For example, when inflation rises or the dollar weakens, gold often becomes more attractive as a store of value, pushing its ounce price higher. On the flip side, stronger economic growth or higher yields on bonds can pull prices down because investors chase better returns elsewhere.
Beyond speculative trading, physical demand from industries like electronics and jewelry also impacts the price. For instance, a sudden surge in demand for luxury watches can nudge gold prices since manufacturers need more raw materials.
The bottom line is that gold's ounce price acts as a real-time barometer of economic confidence, currency strength, and market risk appetite.
Understanding how gold prices are quoted can help you make smarter decisions. Gold price headlines usually refer to the "spot price," which is the current market price for immediate delivery. Meanwhile, futures prices indicate market expectations for the metal's value in the coming months.
If you’re investing or planning to buy gold products, knowing the ounce price helps you gauge if you’re paying a fair rate. It also prepares you for price swings influenced by global events or economic data releases.
The gold ounce price is based on the troy ounce (31.1035 grams).
Spot prices fluctuate constantly during trading hours.
Supply-demand shifts, geopolitical factors, and economic data heavily affect the price.
Spot and futures markets provide different perspectives on gold's value.
In short, keeping an eye on the ounce price of gold lets you track how the market sees this precious metal’s worth right now—as well as what investors expect for the near future.
Understanding how the ounce price of gold is determined is essential for traders, investors, and analysts because it directly influences decisions on buying, selling, and portfolio management. The price isn't just a random figure—it reflects measurable standards and real market activity. Knowing how gold is weighed and what market forces push its price up or down offers practical insights that help you spot opportunities or risks.
Gold prices are quoted in troy ounces, a specific measure used worldwide for precious metals. One troy ounce equals approximately 31.1035 grams. This is different from the common avoirdupois ounce used in everyday situations, which weighs about 28.35 grams. The use of the troy ounce ensures consistency in pricing and trading across global markets, so whether you're buying gold coins, bars, or ETFs, you're dealing with a precise and standard unit.
The difference may seem minor, but it matters in value terms. For example, if gold is priced at $2,000 per troy ounce, the actual amount of gold in a standard ounce (avoirdupois) is less. That means if someone mistakenly priced gold per regular ounce, they’d undercharge or overcharge based on the weight difference. For investors and consumers, this distinction matters when verifying product weights or comparing prices. Always ensure gold price quotes specify 'per troy ounce' to avoid confusion.
Gold prices fluctuate mainly because of basic supply and demand. When demand rises—like during economic uncertainty—prices often increase. If supply grows, perhaps from new mining discoveries or more recycling, prices tend to ease. For example, during 2020’s market turbulence, gold demand surged as investors sought safe-haven assets, pushing the price above $2,000 per ounce.
Spot markets dictate the current gold price for immediate delivery, reflecting real-time transactions. Futures markets, on the other hand, let traders buy or sell gold at predetermined prices for future delivery. Futures contracts help shape price expectations and provide tools for hedging against price swings. These two markets interact constantly; if futures prices significantly deviate from spot prices, it signals changing market sentiment or supply concerns.
Mining output sets the base supply of new gold entering markets. If mines increase production, more gold becomes available, generally lowering prices. However, mining costs and complexities, like deep underground extraction, limit how much can come online quickly. Recycling acts as a flexible supply source—when gold prices are high, scrap gold enters the market more actively, cushioning supply shortages. For instance, during steep price rises, many consumers and industries recycle old or unused gold, influencing immediate availability.
The bottom line is that gold’s ounce price results from a blend of precise measurement and active market forces. Paying attention to these details helps you interpret price movements and make informed investment choices.
Gold’s price per ounce fluctuates for a handful of key reasons, tied closely to economic signals and global happenings. Understanding these factors helps investors and traders anticipate changes and make smarter decisions about when to buy or sell.
Gold as a hedge against inflation plays a big role in its price. When inflation rises, the purchasing power of the dollar drops, and investors often turn to gold as a safe store of value. For example, during the high inflation years of the 1970s in the U.S., gold prices surged dramatically because people lost confidence in dollars. This practical use means that when you hear inflation numbers climbing, gold’s ounce price tends to follow upward as well.
The influence of interest rates and currency strength also affects gold prices significantly. When the Federal Reserve raises interest rates, holding gold— which doesn’t yield interest— becomes less attractive compared to bonds or savings accounts. Conversely, lower rates make gold more appealing. At the same time, the strength of the U.S. dollar matters. A strong dollar makes gold more expensive in other currencies, usually dragging prices down. On the flip side, if the dollar weakens, gold prices often rise, as buyers from abroad find it cheaper to purchase.
Political instability can send shockwaves through gold markets. Conflicts, wars, or unstable governments breed uncertainty, leading investors to flock toward gold. For instance, during the Gulf War in 1990-1991, gold prices spiked as traders sought safety. The practical takeaway is that political tensions anywhere in the world often tighten gold’s supply-demand balance, pushing ounce prices higher.
Similarly, market reaction to crises and uncertainty supports gold’s role as a ‘safe haven.’ Economic crises like the 2008 financial crash or the early 2020 COVID-19 pandemic saw sharp increases in gold prices. Investors pull out of risky assets and pour money into gold, swelling demand quickly. For those tracking gold prices, these moments serve as indicators: rising gold costs can signal broader market stress.
Bottom line: Gold’s ounce price isn’t just about mining costs; it reflects how the world views economic stability, political risks, and currency confidence at any given time.
By keeping an eye on inflation rates, interest changes, currency moves, and geopolitical headlines, you can get a clearer picture of what’s likely to happen with gold prices. That insight can be a powerful tool whether you’re trading gold futures, buying physical bars, or simply managing your portfolio exposure to risk.
Tracking the price of gold is essential for anyone dealing with it—whether you're an investor, trader, or collector. Gold prices fluctuate constantly during market hours, and knowing where these prices come from helps you make informed decisions. This section breaks down how gold prices get quoted and the tools behind tracking them, shedding light on real-time markets and price benchmarks.
The spot price is the current market price for buying or selling gold for immediate delivery. It reflects what a buyer would pay at that moment if purchasing physical gold or settling trades right away. Spot prices are widely quoted in financial news and platforms because they represent the most up-to-date value without delays or contractual commitments. For example, if you visit a gold dealer or look at financial websites, the price you'll likely see for one troy ounce is the spot price.
On the other hand, gold futures contracts are agreements to buy or sell gold at a specific price on a future date. These contracts trade on exchanges like COMEX and allow traders to hedge against price swings or speculate on future movements. Suppose an industrial firm wants to lock in gold prices for manufacturing six months down the line—futures contracts serve this purpose. Traders also use futures to bet on rising or falling prices without handling the physical metal. Because futures involve contracts settling later, their prices may differ slightly from the spot price, depending on factors like interest rates and storage costs.
The COMEX (Commodity Exchange Inc.) in New York and the London Bullion Market Association (LBMA) serve as major hubs where gold prices get set. COMEX operates as the main futures market for gold in the U.S., providing real-time price discovery and high liquidity. LBMA, based in London, manages an over-the-counter market primarily for physical bullion trading. Together, these centers influence global pricing by facilitating thousands of daily transactions among banks, traders, and refiners.
Price benchmarks from these exchanges guide not just traders but also industries, jewelers, and central banks when valuing gold holdings. For example, investment products often reference LBMA’s price fixings as a standard.
Alongside exchanges, price reporting agencies and indexes like the London Gold Fixing and Bloomberg Gold Price Index compile and publish average prices from multiple sources to offer transparent, recognized figures. These benchmarks help smooth out short-term volatility and provide a fair baseline for contracts and valuations worldwide.
Knowing where gold prices come from and how they're tracked gives you a real edge when navigating markets, ensuring you understand the difference between immediate buying costs and future commitments.
Bottom line, staying tuned to spot prices, futures contracts, and major benchmarks offers clarity and control for anyone seriously following gold's ounce price.
Understanding the practical side of gold pricing helps investors and consumers make smarter choices. Whether you're buying gold bars or considering financial products tied to gold prices, knowing how the ounce price affects your decisions can save you money and reduce risk.
When buying gold, one of the first choices is between physical gold and financial products. Physical gold includes coins, bars, and jewelry. These offer direct ownership but often involve storage and security concerns. Financial products like gold ETFs, futures contracts, or mining stocks let you gain exposure to gold prices without holding the metal itself. For example, an investor looking for liquidity and no storage hassles might choose a gold ETF like SPDR Gold Shares instead of buying bullion.
Premiums and fees are critical in understanding the total cost of gold purchases. Physical gold usually comes with a premium above the ounce price to cover minting, distribution, and dealer markup. For instance, a 1-ounce American Gold Eagle coin might cost a few hundred dollars more than the current spot price of gold. On top of that, authentication and storage fees can add up. For financial products, management fees or trading commissions affect returns. Knowing these added costs lets you compare products more realistically.
Investors need accurate, real-time data to keep up with gold’s price changes. Tools like Bloomberg, CNBC, and dedicated apps provide up-to-the-minute gold prices, charts, and news. Having quick access helps you spot entry or exit points without delays that can cost you.
Gold prices can be quite volatile, influenced by global events, economic data, or currency swings. Recognizing these ups and downs as normal helps you avoid overreacting. Tracking long-term trends can reveal patterns—say, gold rallying during inflation fears or geopolitical tensions. This insight supports smarter timing and balanced portfolio decisions.
The bottom line is that understanding how ounce prices impact buying costs, fees, and market timing empowers both investors and consumers to make more informed gold-related decisions. It’s not just about watching a number fluctuate; it’s about knowing how that price fits your strategy and needs.
Learn how price action candlestick patterns reveal market trends for smarter trading decisions 📊. Ideal guide with PDF resources tailored for Pakistani traders 🇵🇰.
📈 Learn to spot and read key price action chart patterns for smarter trading decisions. Get practical tips and PDF resources to improve your market understanding in Pakistan.
Explore binary multiplication concepts and methods 🧮, learn practical steps and challenges, and see how it powers computing systems ⚙️ in Pakistan and beyond.

Explore binary fission 🌱—a simple asexual reproduction method in single-celled organisms. Learn its steps, role, and common myths in biology.
Based on 9 reviews