
Bearish Candlestick Patterns Explained
📉 Learn how bearish candlestick patterns signal market drops, helping traders in Pakistan spot trends, manage risks, and improve timing in trades.
Edited By
Emily Carter
Candlestick patterns are essential tools for traders and investors looking to understand market sentiment through price action. These patterns visualise how buyers and sellers have behaved during a specific timeframe, making them especially useful in volatile markets like Pakistan’s stock exchange or forex trading. By carefully reading candlestick charts, you can identify potential price reversals, continuations, and indecision points.
Unlike simple line charts that only show closing prices, candlesticks reveal the open, high, low, and close—giving a fuller picture of market dynamics. For example, a bullish engulfing pattern, where a small red candle is followed by a larger green candle covering it, often signals a shift from selling pressure to buying strength. This can guide traders to enter the market at a more favourable price.
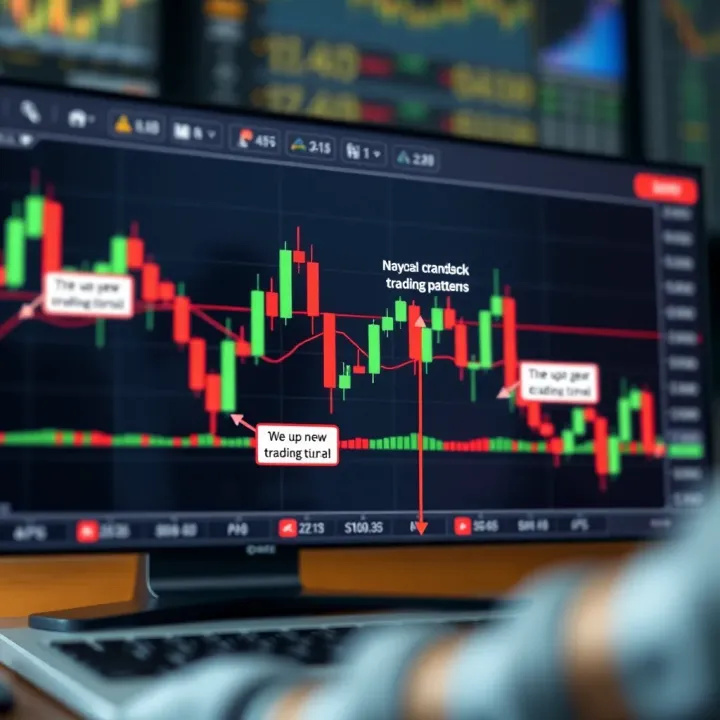
Most traders in Pakistan use candlestick patterns alongside other indicators such as volume and moving averages to confirm their strategies. Understanding patterns like doji, hammer, shooting star, and morning star helps you anticipate market moves rather than react late. This proactive reading can save you from costly mistakes amid Pakistan’s frequently volatile trading sessions.
Candlestick patterns are not foolproof but give valuable hints about market psychology that other chart types might miss.
To read candlestick charts effectively, observe the context around each pattern:
Trend direction: Patterns are more reliable when aligned with the existing trend.
Pattern size and shape: Larger bodies with small wicks indicate strong momentum.
Position on the chart: A hammer near a support level can offer stronger buy signals.
For Pakistani traders, having access to quality guides and PDFs on candlestick patterns can sharpen skills significantly. Look for resources that explain these patterns with local market examples and test them in demo accounts before applying real money.
In this guide, you’ll find practical advice on recognising key candlestick patterns, understanding their implications, and applying them wisely in your trading routines. Whether you’re active on the PSX, forex, or commodity markets, these insights can boost your analysis and decision-making.
By building this foundation, you’ll be better equipped to manage risks and spot entry and exit points with more confidence. Keep in mind: consistent practice and combining patterns with other technical signals usually yields the best results in Pakistani markets.
Getting a solid grasp of candlestick charts is the foundation for any trader aiming to navigate the markets confidently. These charts offer a visual way to understand price movements within a specific timeframe and provide clues about market sentiment. When you understand what each candle represents, you can make more informed decisions rather than relying on guesswork.
Originally developed in Japan during the 18th century by rice traders, candlestick charts have stood the test of time for their straightforward yet detailed way of showing price action. These charts gained international popularity because they offer more information than simple line charts, making them useful for spotting trading opportunities. In Pakistan's dynamic markets—whether in equities or forex—knowing this background helps you appreciate why so many traders still rely on them.
Each candlestick captures four essential data points: the opening price, closing price, high, and low of a trading period. These four points combined create the candle's shape—offering insight at a glance.
The main components of a candle are the body and the wicks (sometimes called shadows). The body represents the difference between the open and close prices. If closed higher than open, it's a bullish candle; if closed lower, bearish. The wicks show how far price moved beyond the open and close during that period. For example, a long wick at the top suggests sellers pushed prices down after a high point, indicating possible resistance.
Candlestick charts differ from other types like line or bar charts primarily in the richness of detail. While a line chart connects closing prices, losing the intra-period highs and lows, candlesticks provide a fuller picture. Bar charts do offer similar data points but are less visually intuitive; the body in candlesticks makes identifying trends and reversals quicker. This advantage particularly helps traders manage quick moves during volatile sessions common in Pakistan's stock exchanges.
The first step in reading patterns is distinguishing bullish from bearish candles. Bullish candles, where the close is higher than the open, are often coloured green or white, signalling buying strength. Bearish candles, on the other hand, usually appear red or black and show selling pressure. For instance, if a bullish candle follows a series of bearish ones in a downtrend, it might hint at a near-term reversal.
Identifying trend direction requires observing sequences of candles rather than isolated ones. A sequence of higher highs and higher lows in bullish candles often confirms an uptrend. Conversely, lower highs and lower lows suggest a downtrend. In practice, spotting these sequences helps traders decide whether to enter or exit positions, particularly in fast-moving sectors like energy or banking.
Beginners often stumble by placing too much emphasis on individual candle patterns without context. One common mistake is acting on a single Doji candle as a reversal signal without confirming volume or subsequent candle behaviour. Also, confusing a hammer for a hanging man just because they look similar can lead to misguided trades. Remember, no pattern guarantees outcomes; combining candle analysis with other tools improves reliability.
Clear understanding of how to read candlestick charts can save you from costly mistakes and sharpen your timing for entries and exits.
Mastering the basics of candlestick charts forms the backbone of effective trading. With these insights, you are better geared to interpret market moves and use candlestick patterns as part of a broader strategy.
Mastering key candlestick patterns is essential for traders looking to anticipate price movements effectively. These patterns provide insights into market psychology, helping identify potential reversals or continuation of trends. Recognising these patterns at the right moment can offer practical advantages such as timely entry or exit, reducing losses, and maximising gains.
Doji and its variations represent indecision in the market. A Doji forms when the opening and closing prices are nearly equal, leaving a very small or no real body. This signals that buyers and sellers are at a stalemate, which often precedes a reversal or a pause in the prevailing trend. For instance, after a prolonged climb in the KSE-100 index, spotting a Doji could warn traders that the bullish momentum is weakening.

Variations like the Dragonfly and Gravestone Doji add more context depending on their wicks. Traders should look for confirmation in the following candles before making decisions, as Doji alone doesn’t guarantee an immediate reversal but highlights caution.
Hammer and Hanging Man look similar but serve different roles. A Hammer appears during a downtrend with a small body and a long lower shadow, indicating that sellers pushed prices down but buyers regained control by close. It hints at a possible bullish reversal. On the flip side, the Hanging Man forms in an uptrend and warns that selling pressure is increasing, hinting at a possible downturn. For example, if a textile sector stock shows a Hanging Man after weeks of gains, traders might anticipate a correction.
Shooting Star and Inverted Hammer also have long upper shadows but differ by trend context. The Shooting Star shows up at the top of an uptrend and signals rejection of higher prices, suggesting a bearish reversal. Conversely, the Inverted Hammer at the bottom of a downtrend implies buyers are testing the market, possibly leading to a rally. Pakistani traders can watch these closely during volatile sessions, especially in sectors sensitive to news like energy or banking.
Bullish and Bearish Engulfing patterns signal strong shifts in momentum. A Bullish Engulfing occurs when a small bearish candle is followed by a larger bullish candle that completely covers it, suggesting a surge in buying interest. This pattern can be a strong reversal signal, especially on daily charts of PSX-listed companies after a downtrend. Conversely, the Bearish Engulfing pattern signals sellers taking control when a large bearish candle swallows the previous smaller bullish candle.
Morning Star and Evening Star are three-candle patterns indicating trend reversal with added reliability. The Morning Star forms at a downtrend low with a small middle candle (showing indecision) between a strong bearish and a strong bullish candle, marking the start of an uptrend. The Evening Star signals the opposite—trend exhaustion at an uptrend peak. These patterns help traders avoid false signals by showing market hesitation and a shift in sentiment.
Three White Soldiers and Three Black Crows deliver confirmation of strong trends. Three White Soldiers are three consecutive long bullish candles with closes near their highs, indicating consistent buying pressure. This pattern suggests bullish confidence often lasting several sessions. The Three Black Crows pattern, with three long bearish candles, warns of continued downward pressure. Pakistani equity traders rely on these during earnings seasons or important political events that affect sentiment.
Consistent study and practice recognising these candlestick patterns will sharpen your trading strategy, helping you make well-informed decisions in the Pakistani markets.
Understanding candlestick patterns is useful, but applying them to the Pakistani market requires attention to local factors. Market conditions here, including volatility and sector dynamics, affect how these patterns behave. Traders who adapt their analysis accordingly often get better signals and avoid costly mistakes.
The Pakistan Stock Exchange (PSX) experiences pockets of intense volatility during certain hours, especially near market open and close. This means candlestick patterns forming during these times might be more exaggerated and less reliable than those in steadier periods. For example, a hammer candle at closing might not carry the same weight if the volume was unusually high during volatile trade bursts. Traders must watch the time context closely when interpreting patterns.
Moreover, weekend closures and Pakistan’s unique market holidays can lead to gaps in price, affecting candlestick interpretation. Unlike 24/7 forex markets, these pauses can disrupt pattern continuity. Understanding this helps avoid false signals.
The Pakistani rupee’s fluctuations against the dollar and other currencies frequently influence sectors like textiles and energy. When the rupee depreciates sharply, exporters often see stock gains despite bearish candlesticks, as their profitability rises after currency conversion. So, a bearish pattern in the textile sector might not always signal a sell-off but a temporary pullback amid longer uptrends supported by currency impact.
Hence, aligning candlestick outcomes with rupee trends can improve trade decisions. Keeping an eye on rupee-dollar parity during daily trading will prevent misreading patterns solely based on price bars.
Candlestick patterns do not act the same across all sectors in Pakistan. The textile sector, reliant on exports, tends to react strongly to global demand and rupee value. Energy stocks are affected more by local policy shifts and oil price movements, so some patterns here might follow news cycles rather than pure technical signals.
Banking stocks usually show steadier patterns shaped by interest rate announcements or State Bank of Pakistan’s monetary decisions. For instance, a bullish engulfing candle post an interest rate cut announcement often confirms genuine buying interest. Traders should learn historical pattern behaviour sector-wise for sharper reads.
Volume adds weight to candlestick patterns by showing trader conviction. A doji candle on low volume might mean indecision, but the same pattern on high volume signals a stronger possible reversal. Moving averages, such as the 50-day or 200-day, help confirm trend direction alongside candlesticks to avoid falling for false breakouts.
For example, if a bullish engulfing pattern forms above the 50-day moving average with rising volume, this generally suggests a higher chance of trend continuation. Pakistani traders often use these signals together for timing entries more confidently.
RSI shows if a stock is overbought or oversold. Combining RSI with candlestick patterns reduces guesswork. A hammer candle appearing when RSI is below 30 (oversold) gives a stronger buy signal than just the candle alone.
This approach particularly works well during Pakistan’s volatile days when sudden news affects prices. RSI prevents chasing poor entries by signalling extreme sentiment zones.
Local political developments, SBP policy changes, and FBR tax updates heavily move Pakistan’s markets. Candlestick patterns matched with fresh fundamental news give practical trading edges. For example, a morning star pattern emerging just after a positive quarterly report from an energy company is more trustworthy.
Ignoring the news risks misinterpreting patterns as markets often ‘price in’ such factors. Seasonal cycles like budget announcements or election periods also influence pattern reliability.
Using candlestick patterns in isolation in Pakistani markets can mislead. Awareness of local market hours, currency trends, sector specifics, volume signals, RSI, and timely fundamental news improves accuracy and profitability for traders here.
In summary, tailoring candlestick analysis to Pakistan’s specific trading environment helps make better trading calls and builds stronger market confidence.
Having trustworthy PDFs on trading candlestick patterns is essential for anyone serious about market analysis. These documents provide structured knowledge that helps you recognise key patterns accurately, reducing guesswork and boosting your trading confidence.
Official broker and market analysis websites often publish detailed educational content. For example, brokers active in Pakistan like IG or local trading firms sometimes share PDFs containing pattern explanations tailored to regional market behaviour. These resources come from professionals who understand market nuances, so they’re a reliable starting point.
Educational platforms and trading academies offer comprehensive guides too. Institutions such as the Pakistan Institute of Development Economics or private trading courses frequently provide PDFs along with their training. These cover fundamentals and advanced strategies, often supplemented with exercises or real market examples to strengthen your skills.
Government sources and securities regulators like the Securities and Exchange Commission of Pakistan (SECP) or State Bank of Pakistan occasionally publish market analysis reports. While not always solely focused on candlestick patterns, they provide essential context on market regulations and trends that enhance your understanding of how these patterns perform under local conditions.
Organising and bookmarking key patterns in your PDFs makes review easier. For instance, flagging patterns like Bullish Engulfing, Doji, or Morning Star helps quickly refer back when you spot them on charts. You can also annotate pages to note personal observations or tips, making the learning process interactive rather than passive.
Practicing chart reading alongside PDFs is crucial. While PDFs show static examples, applying that knowledge to live charts or trading platforms like PSX’s market data helps cement your understanding. For example, match a Hammer candle example from a PDF with its appearance on an HBL stock chart to see how it foretells potential reversals.
Integrating PDF resources with trading journals improves long-term retention and performance. Record every trade where you noticed a candlestick pattern, note the PDF reference that helped, and track outcomes. Over time, this habit reveals which patterns work well in your trading style and the Pakistani market climate.
Keeping PDFs as practical manuals rather than just reading material turns them into daily tools, supporting consistent growth and better trades.
Organising your PDF resources carefully and tying their content to real trading experience is the smartest way to benefit fully from them. This approach makes complex concepts manageable and technical learning a routine part of your trading journey.
Using candlestick patterns in trading requires more than just recognising shapes on a chart. Practical application involves managing risks carefully and building a trading plan that suits market conditions. Let’s break down key tips that help you trade with confidence and avoid common pitfalls.
Confirming signals before entry or exit is essential. A single candlestick pattern doesn’t always guarantee a price move. For example, spotting a bullish engulfing pattern in the textile sector on PSX might look promising, but without confirming volumes or support from an RSI indicator, the signal can be misleading. Waiting for two or more confirmations, like volume increase or moving average crossover, can save you from entering prematurely.
Setting stop-loss based on pattern behaviour protects your capital against unexpected reversals. Take the hammer pattern for instance: placing the stop-loss just below the low of the hammer candle keeps losses limited if the market turns bearish. This approach respects the pattern’s natural price movement and avoids unnecessary wipeouts, especially in volatile sectors like energy or banking.
Avoiding overreliance on patterns alone is critical. Candlestick patterns work best alongside other tools; relying solely on patterns can lead to false signals. Imagine you act on a shooting star pattern without checking overall market trends or news announcements – this could cause losses if external factors overpower technical signals. Patterns show possibilities but not certainties.
Combining candlesticks with market context means understanding what’s happening outside the chart. For Pakistani markets, this includes geopolitical developments, rupee fluctuation, or corporate earnings reports. For instance, a morning star pattern might indicate reversal, but if market sentiment is strongly bearish due to new taxes, it’s wise to be cautious.
Practising patience and discipline is vital in candlestick trading. Often, traders get tempted to react instantly to a pattern without waiting for confirmation or volume support. A disciplined trader waits for a clear signal and sticks to the plan, even if it means missing some moves. This patience prevents impulsive decisions, especially helpful during choppy market phases.
Reviewing trades to improve interpretation skills sharpens your ability to use candlestick patterns effectively. Keep a trading journal recording each trade’s rationale, outcome, and what the candles indicated. Over time, you’ll notice which patterns worked better in certain sectors or timeframes. For example, your review might reveal that three white soldiers tend to perform well in banking stocks during bullish market cycles.
Taking these practical tips seriously allows you to move beyond just recognising patterns, towards making smart, calculated trades that fit Pakistan’s unique market environment. Keep experimenting, learning, and refining your strategy for steady progress.
📉 Learn how bearish candlestick patterns signal market drops, helping traders in Pakistan spot trends, manage risks, and improve timing in trades.
📊 Master key candlestick patterns for trading in Pakistan with our detailed guide. Access reliable PDF resources for deep insights and smart market moves!
📈 Master candlestick patterns from single to complex forms to better read market psychology and predict price moves in Pakistani and global markets.

📈 Master advanced candlestick patterns for smarter trading! Get practical tips, quick recognition tricks, and in-depth insights to improve your market analysis today.
Based on 10 reviews